Data Ingestion View
Data Ingestion View is currently in BetaData Ingestion View is currently in Beta. This is our initial step towards providing customer admins visibility into the ingestion health of their configured systems.
Since this is in Beta, you may come across some unexpected instances, but you can always share your feedback on community for us to improve over time.
Resource Lifecycle
Moveworks connects with your systems to power key native plugins in the Moveworks AI Assistant such as Enterprise Search, Forms, Group Access, Software Access, and more. Moveworks fetches data such as Knowledge articles, Files, Forms, Users, Groups, and Permissions from these your enterprise systems, based on the the plugins and configurations enabled.
Once the data is fetched, it goes through a series of internal processing and enrichment steps, before getting served and available to all the users.
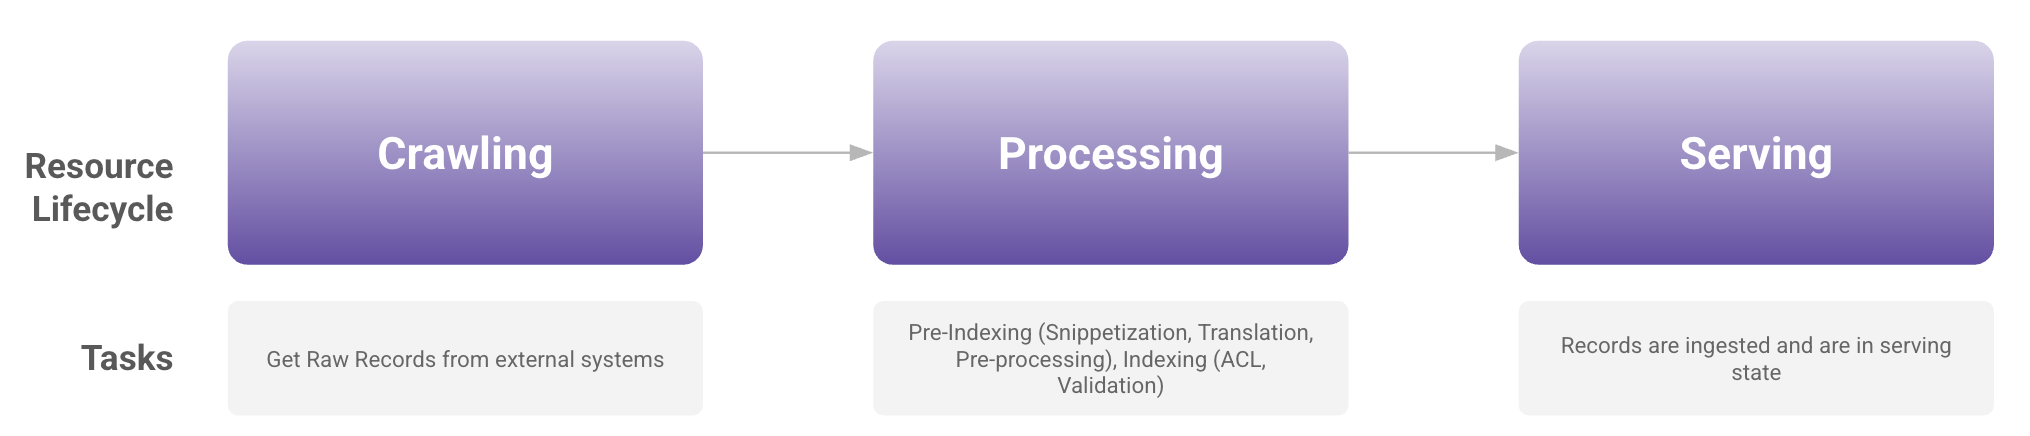
To summarize, once a connector is created and when a resource such as Knowledge, Files, or Forms are configured, it goes through the following steps:
What is Data Ingestion View?
The Data Ingestion View provides customer administrators with observability and troubleshooting capabilities for the first phase of the resource lifecycle, i.e. for crawling and fetching of resources.
Please note, data ingestion viewer metrics should not be compared with the ingested knowledge, files, users, or forms screens within Moveworks Setup because these screen fundamentally serve different purposes.
Data Ingestion Viewer is primarily to monitor if Moveworks is able to connect to your configured system and whether Moveworks is able to successfully fetch raw records from your systems.
Ingested Knowledge, Files, Forms, and Users screens on the other hand is primarily used to monitor records that are available in the index, after it goes through the processing & indexing steps.
With data ingestion viewer tool, customer admins can:
- Monitor the health of their configured systems
- View the status of historical ingestion runs (full and incremental)
- View the cadence of these resource ingestion runs
- View error summary for failed ingestion runs
- Quickly redirect to relevant connector, or resource ingestion config.
How to access Data Ingestion Viewer?
- Log into Moveworks Setup
- Navigate to Data Ingestion Viewer within Core Platform section of the left nav
Data Ingestion Viewer Components & Definitions
Resources
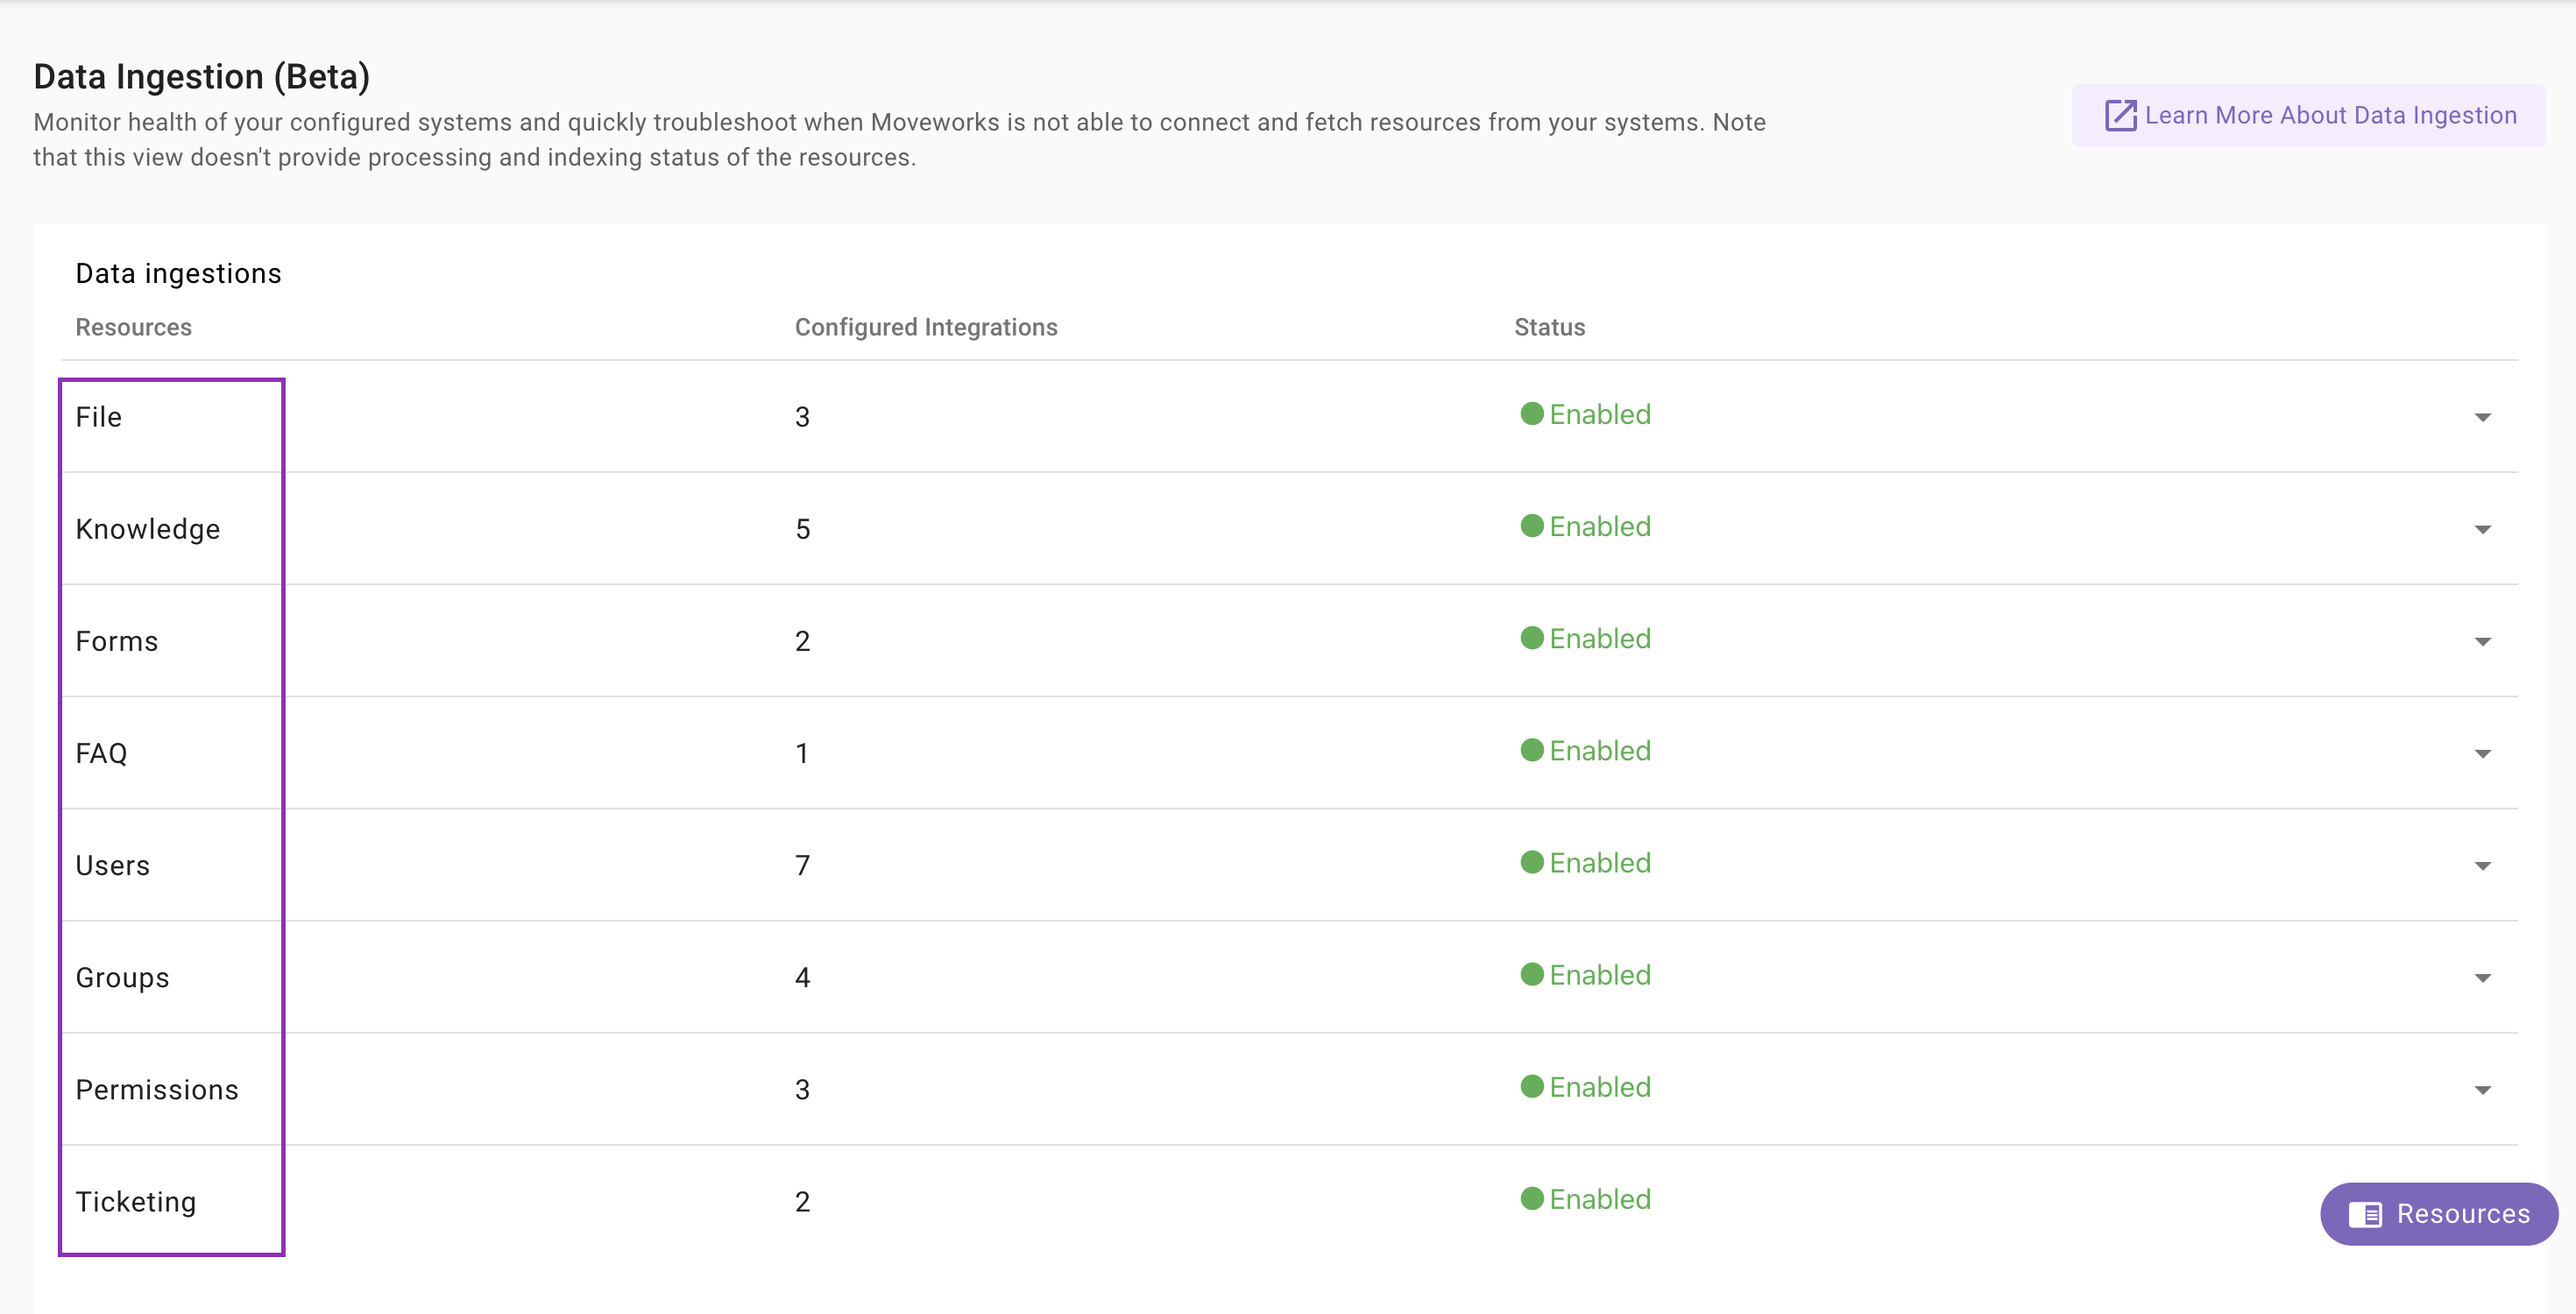
Resources are entities that can be ingested within Moveworks. In Data Ingestion View, you can view health of configurations across following resources:
- Files
- Knowledge
- FAQs
- Forms
- Users
- Groups
- Permissions
- Ticketing
Configured Integrations
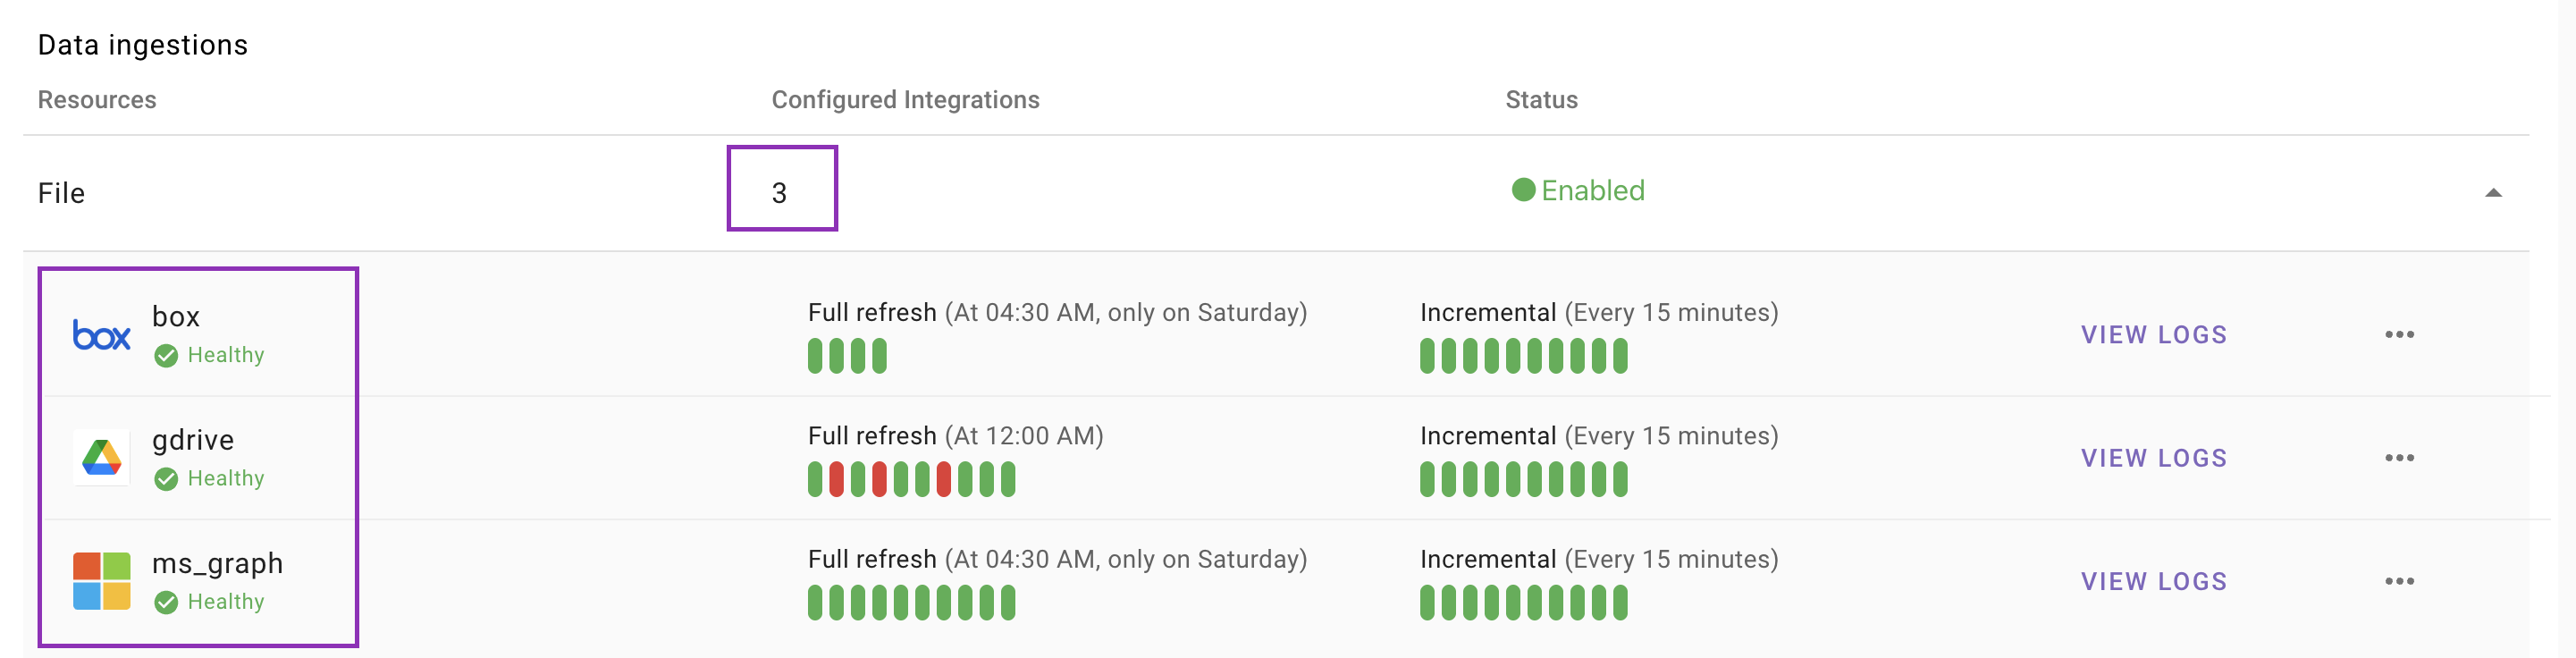
These represent the associated configurations for that resource. For eg. In the below image, Files is being ingested from three systems: Box, Google Drive, and MS Graph (Sharepoint).
Note for Groups & Permissions
- In case of Groups, we currently only show configurations specific to Content (Files & KBs). It does not cover ingestion of records from Access DL systems. This is on roadmap.
- In case of Permissions, currently we do not support showing ServiceNow ACL permissions flow. This is on future roadmap.
Resource Status
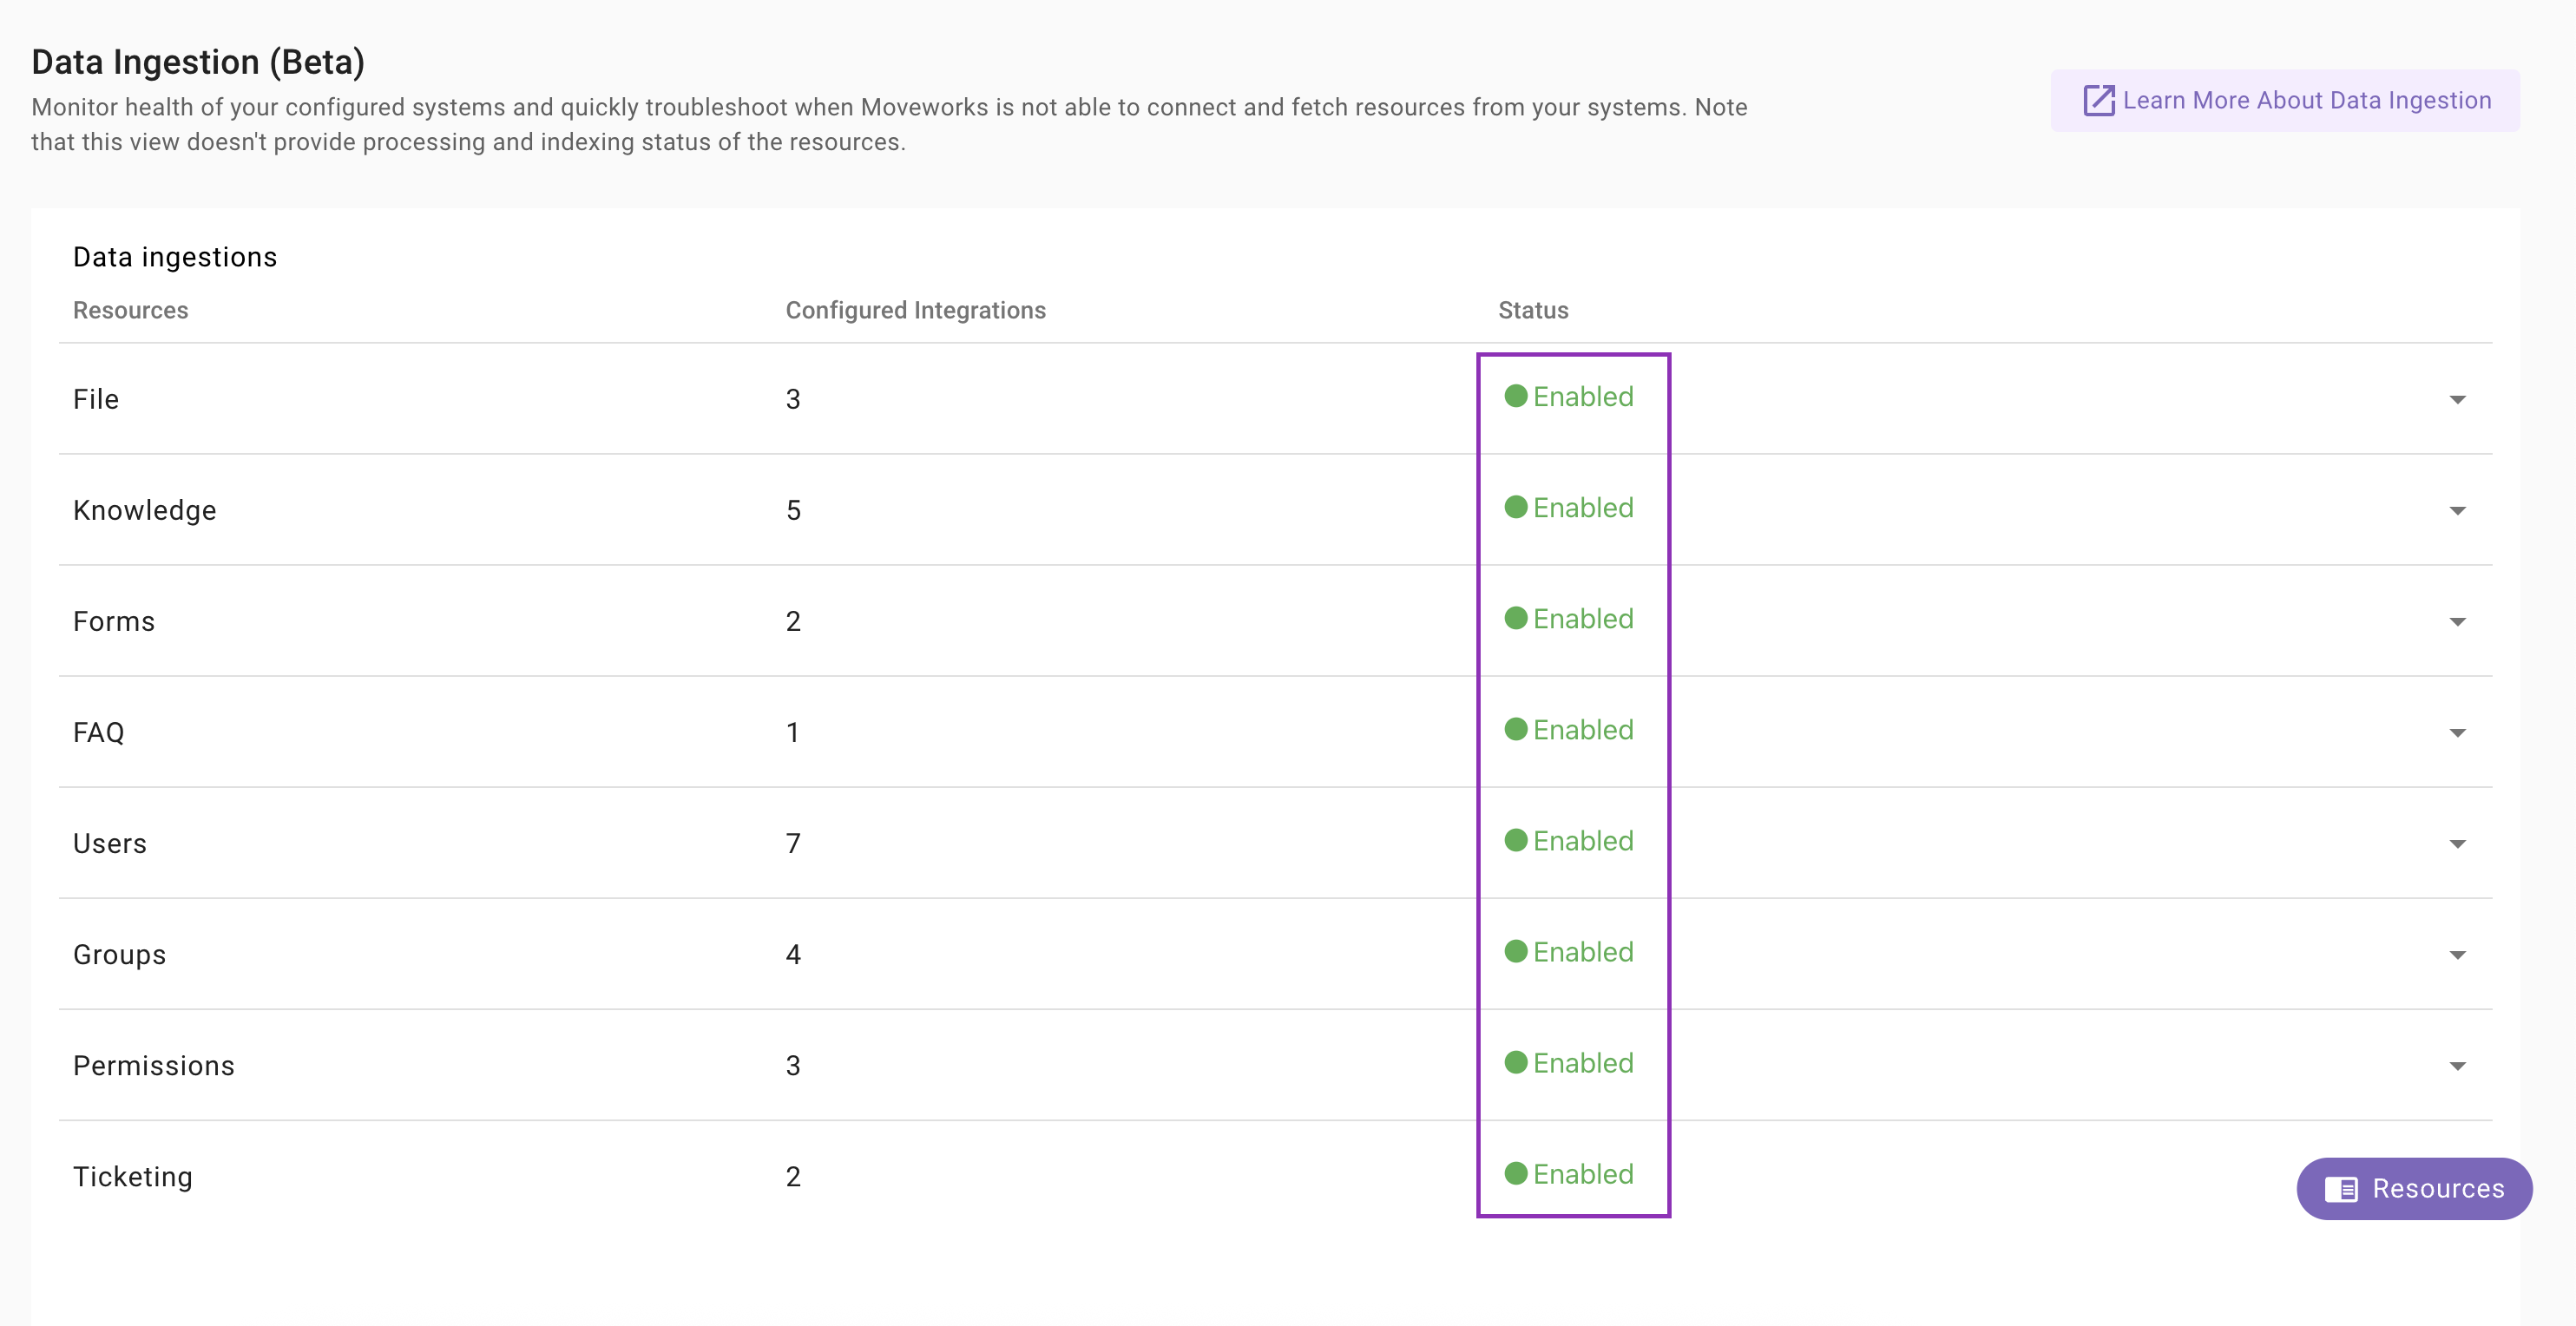
Status represents whether the ingestion flows are turned ON or NOT for a given resource. If a resource is Disabled, this means no records will be ingested from external systems, even if resource ingestion configs are configured.
If a resource is not enabled, and you want to get enable that resource, please reach out to support or your Moveworks' customer success team.
Ingestion Runs: Full & Incremental
There are two types of ingestion runs:
- Full Ingestion: Entire resource corpus is fetched from the external system. It generally happens at a relatively larger duration to prevent load on external systems.
- Incremental Ingestion: In incremental ingestion, only updates (content new additions/ deletions, permissions updates, etc) are pulled from the external system (via webhooks or Delta APIs). This is supported for limited number of systems across few resources. This is a more scalable approach in getting updates quickly into Moveworks without putting much load on the external systems.
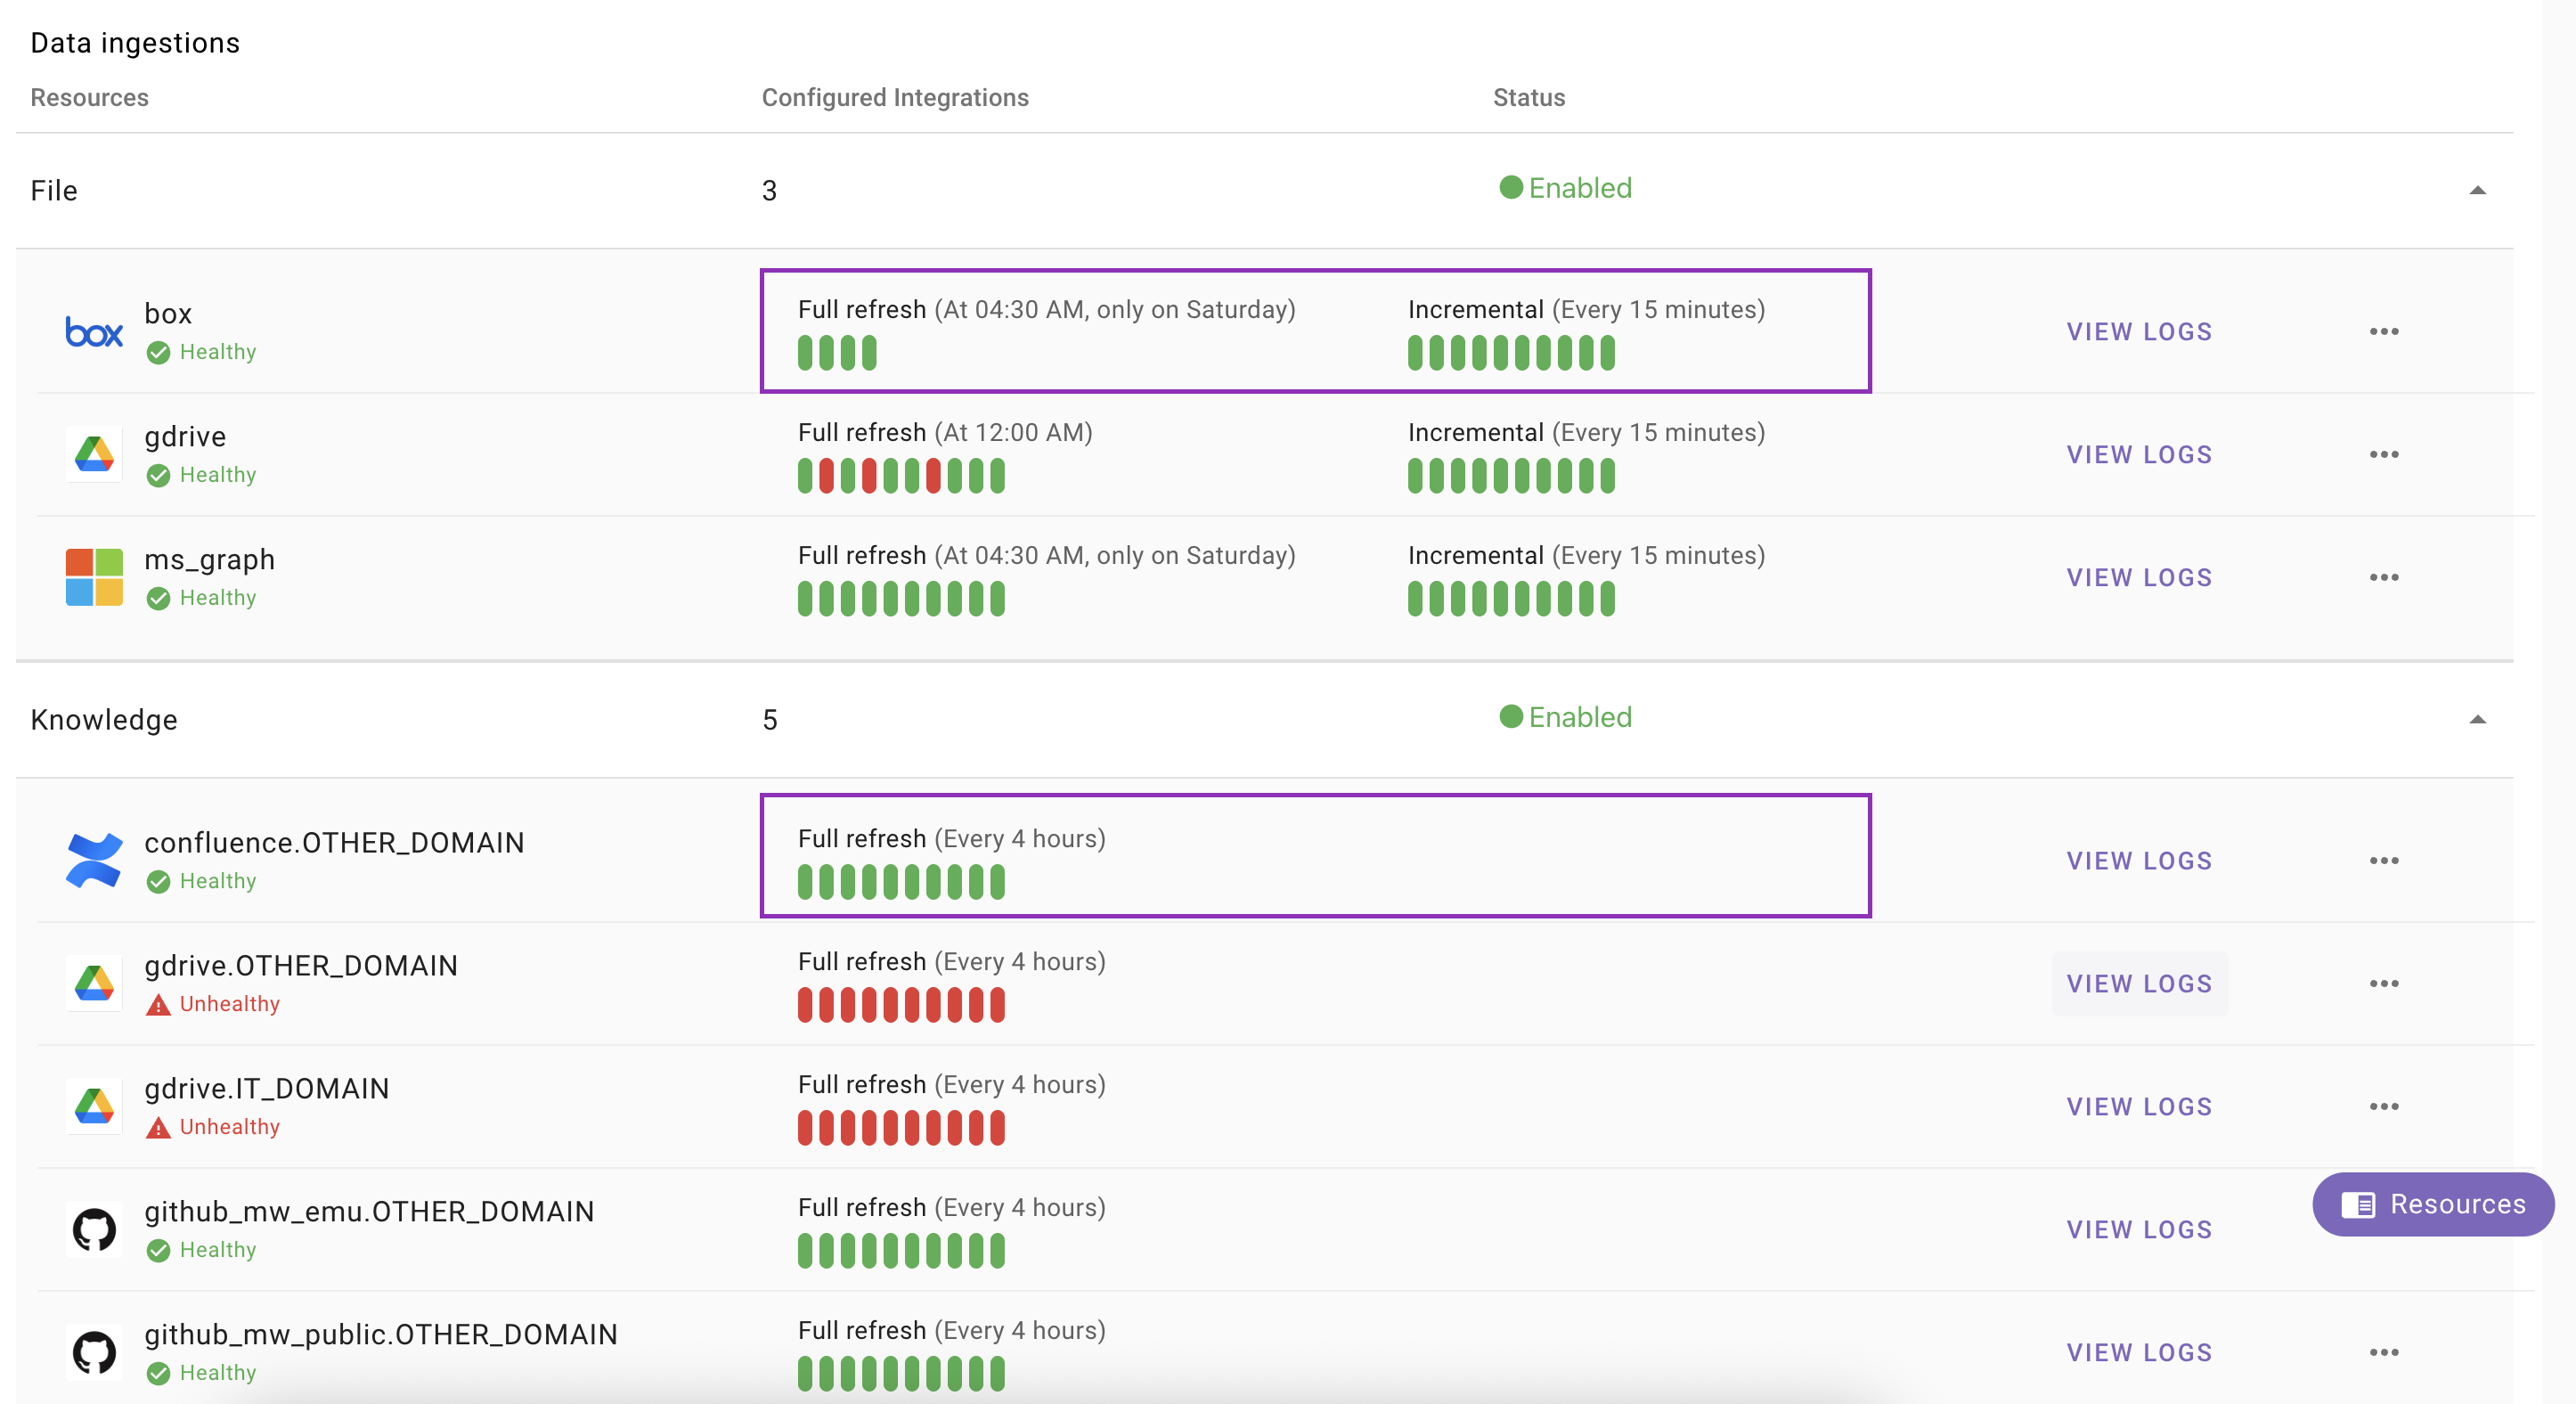
Ingestion Run Cadence
This is the cadence at which Full Ingestion or Incremental ingestion runs happen for a specific integration, for a specific resource.
Ingestion cadence is not customer configurable. In case, you want to adjust the frequency, reach out to Moveworks Support or your assigned Moveworks customer success team.
Health of Ingestion Runs
Green bars denote the success of the ingestion run.
Red bars denote failure of the ingestion run.
If the latest ingestion run (which ever of the full or incremental was latest) failed, the health of the Ingestion will be marked as Unhealthy and vice-versa.
View Logs
In case a resource integration is unhealthy, it is important for customer admins to understand why this has been failing. For troubleshooting you can click on View Logs. This opens up a new View Log pop-up.
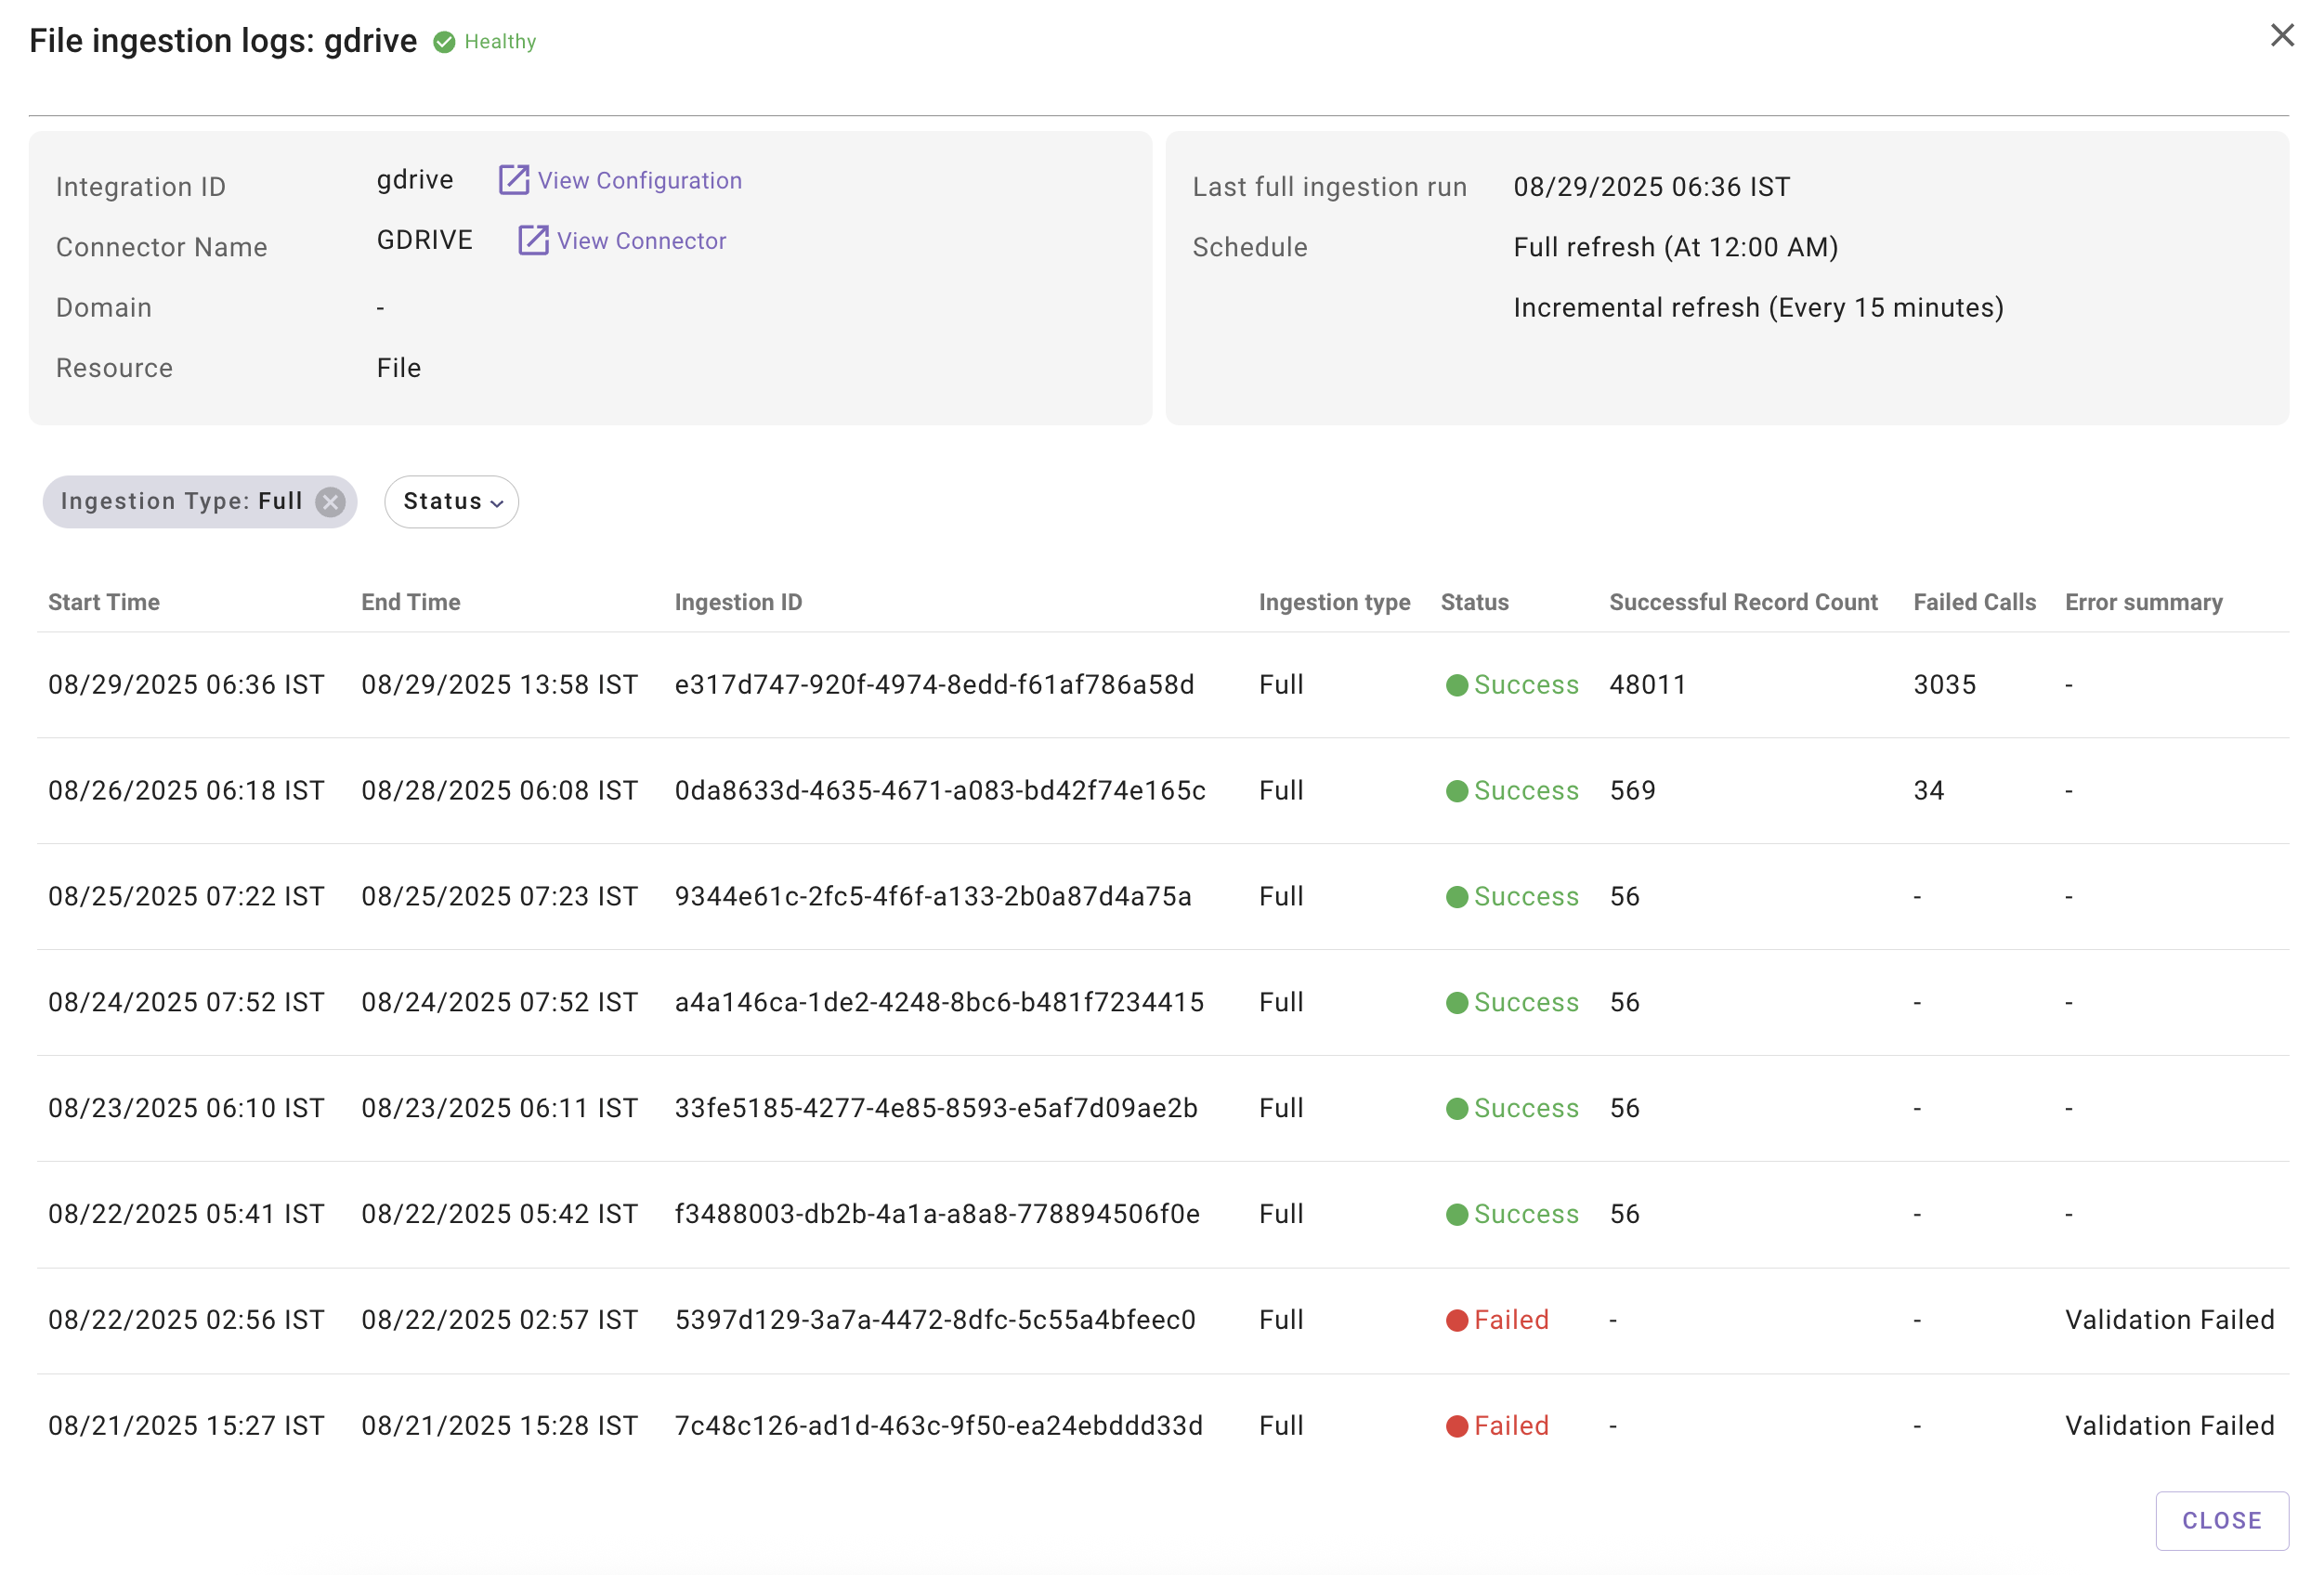
View Logs Table datapoints:
-
Start Time: Time at which the ingestion run started.
-
End Time: Time at which the ingestion run got completed.
-
Ingestion ID: Unique ID of the ingestion run. Useful to share with Moveworks support team, in case of any troubleshooting assistance.
-
Ingestion Type: Denotes whether the ingestion run was Full or Incremental.
-
Status: Success, Failed or Skipped status for the ingestion runs.
Important Note:
Skipped status appears when there are no new records or updates in the external system since the last successful sync. This is expected behavior and indicates your data is current. New records will be automatically ingested during the next ingestion run.
-
Successful Record Count: Denotes how many records were successfully ingested, when the ingestion was successful. This number can be 0 even if the ingestion run was successful - this typically happens in cases of incremental ingestion where no resource updates were made on the external system side. In case of ingestion failure, this will be blank.
-
Failed Calls: Denotes how many calls failed while trying to ingest records successfully. In case of ingestion failure, this will be blank.
-
Error Summary: Simplified error message based on the external system response. An ingestion may fail if:
- The connector credentials are not valid
- There is a server side issue (Deadline exceeded, Time-outs, Rate-Limits)
- There are no permissions/ authorization for Moveworks to ingest any record
- Validation failed
-
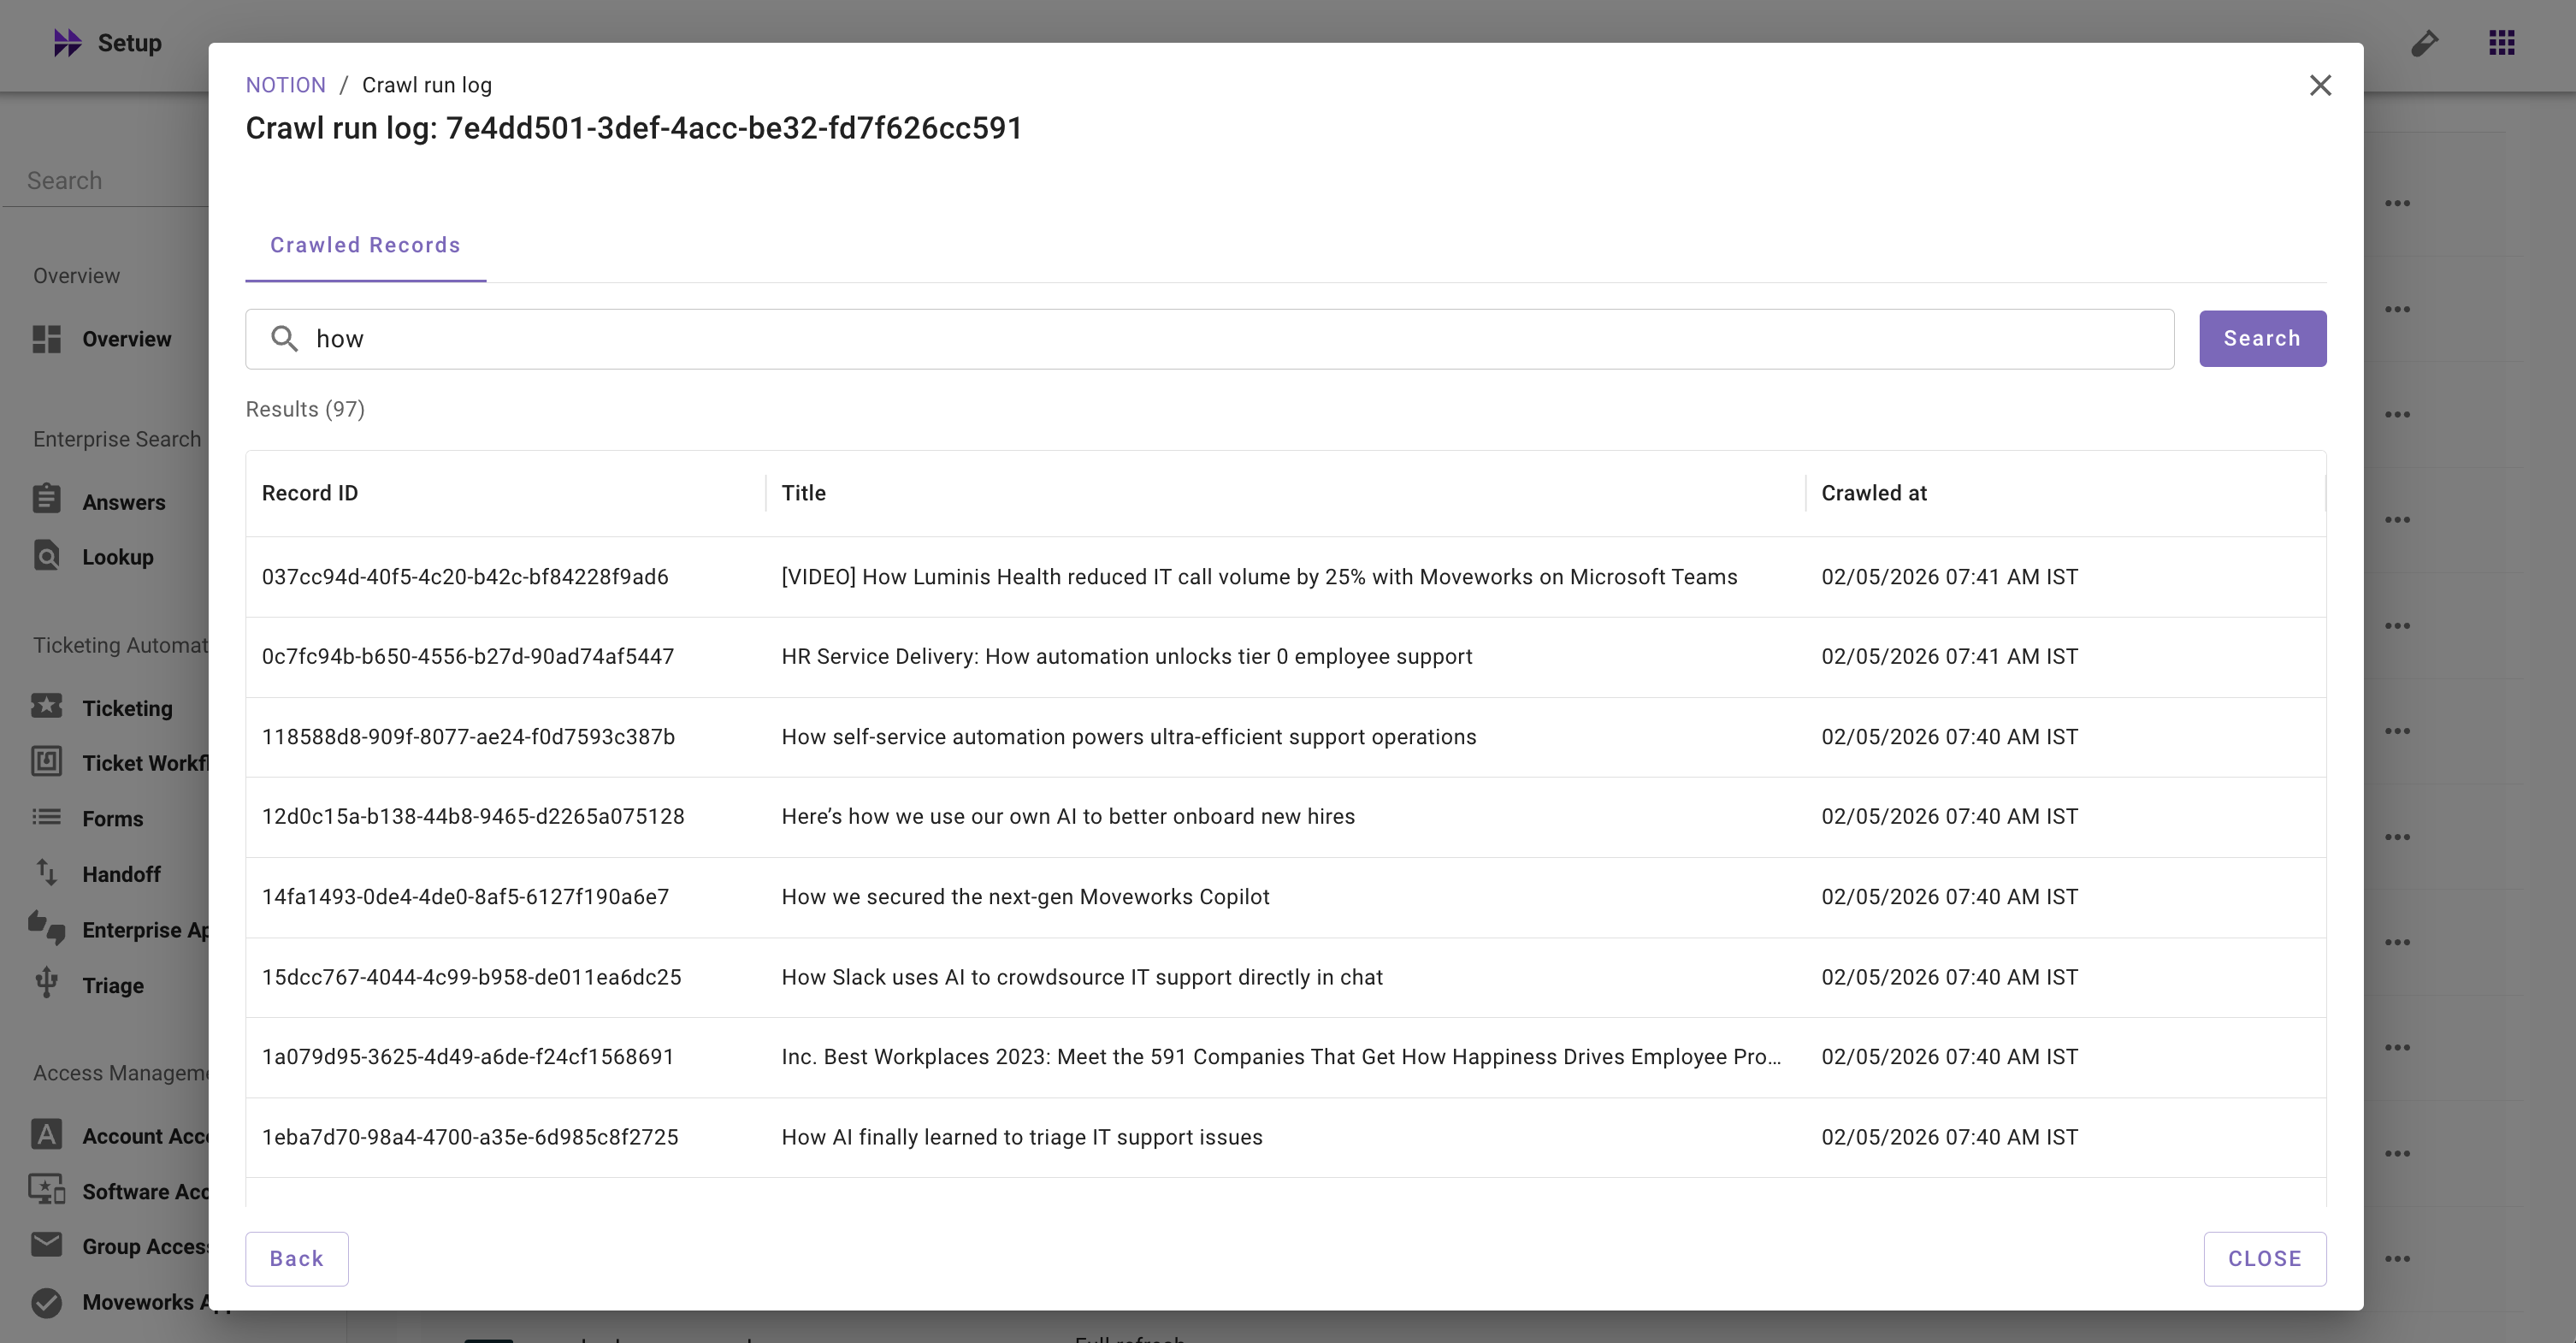
View Details: Provides granular visibility into a specific crawl run, showing which records were successfully crawled. This helps Moveworks admins troubleshoot record-level issues such as when expected records aren't being ingested.
Note for Error SummaryError summary is available only for Files, Knowledge, Users, Groups, and Permissions.
How to use Error Summary to debug?
- Refer to the error message.
- Look up the Error code and Error Message for the specific system via Google, or your favorite AI tool.
- There are four general themes of errors:
- Incorrect Credentials/ Issues with Authorization: Review access requirement documents, and update the connector credentials.
- Permission Related Issues: Review and add relevant scopes or roles to the connector based on the access requirements documentation.
- Intermittent System Side Issues : Generally - Error 500 or 503 indicate intermittent issues. Work with your system admins, or contact the vendor's support to address this.
- Validation failed error message: These are Moveworks imposed validations. Generally an ingestion that shows a validation failed error message is likely to fail due to any of the three scenarios:
- Empty record validation: No records were fetched in the full ingestion run. (This could happen due to a mis configuration or if the native system doesn't have any records in it).
- Record limit validation: The dataset reached the supported content limit (This is only for files)
- Large record drop: More than 50% of the records dropped from the last successful full ingestion run (applicable for KB only).
How to use View Details for troubleshooting?
Crawled Records: Records that were successfully crawled from the source system during a particular ingestion run.
- Record ID: The unique ID of a file fetched from your external system
- Title: The title of a file fetched from your external system
- Crawled at: Timestamp when the content was last crawled
Key scenarios for using View Details for troubleshooting:
- When users report they can't find specific content - Check if specific articles or files were actually crawled from source system when users say they should be able to find them in search results but can't
- When content appears outdated or incomplete - Verify what content was actually retrieved during recent crawl runs
- After adding new content sources - Validate that newly configured sites, drives, or spaces are being crawled and content is being crawled from source system as expected
- After setting up or modifying a connector - Verify that your connector is successfully retrieving content from all intended sources and nothing is being missed due to configuration issues
- After source system changes - Validate that content continues to be crawled successfully after updates, migrations, or permission changes in your source systems
FAQs
- My resource status is showing as Disabled. How do I enable it?
- If there are no configurations associated with the Resource, we first recommend you to get the system configured. Then work with Moveworks support or Moveworks customer success team to get the resource enabled for your org.
- Ingestion run is successful but the successful & failed records are showing empty. Is this expected?
- Yes, this is expected and generally observed for incremental ingestion runs. It is very well possible that no datapoints were returned for incremental ingestion runs from Delta APIs that is scheduled for every few mins.
- There is no error summary for ingestion failures in case of Forms, and FAQs?
- Currently, error summary is available only for Files, Knowledge, Users, Groups, and Permissions. We plan to add support for other resources in coming months.
- Is Access DL ingestion configuration supported in this view?
- In case of Groups, we currently only show configurations specific to Content (Files & KBs). It does not cover ingestion of records from Access DL systems. This is on roadmap.
- Is ServiceNow ACL supported in the permissions view?
- In case of Permissions, currently we do not support showing ServiceNow ACL permissions flow. This is on future roadmap.
- I am seeing a historical ingestion run to be still in progress. Is this expected?
- In rare instances, some ingestions do not get completely successfully and time out. In those rare case, they might still show in progress. However, you should not be much concerned with that. For your troubleshooting and monitoring, viewing the status and logs of the latest full or incremental ingestion run will suffice.
- Count of successfully ingested records in the view logs does not match with the ingested records in ingested Knowledge/ Files/ Users/ Forms screen. Is this expected?
- This is expected. Data ingestion viewer shows count of ingested records in the each full or incremental runs. Post which the records go through a series of processing, validations, before reaching the index and to the serving state. Therefore we must not compare the view log metrics with the ingested resource screens.
Updated 6 days ago