Ticketing Insights
Overview
The Ticketing Insights report is available to all customers with access to AI Assistant Insights. This report provides insights into the tickets filed and live agent transfers completed through AI Assistant. It covers details such as the types of tickets being filed and the number of tickets being filed for particular topics.
🎥 See a walkthrough - Watch this Academy video on Ticketing Insights
How to access the report
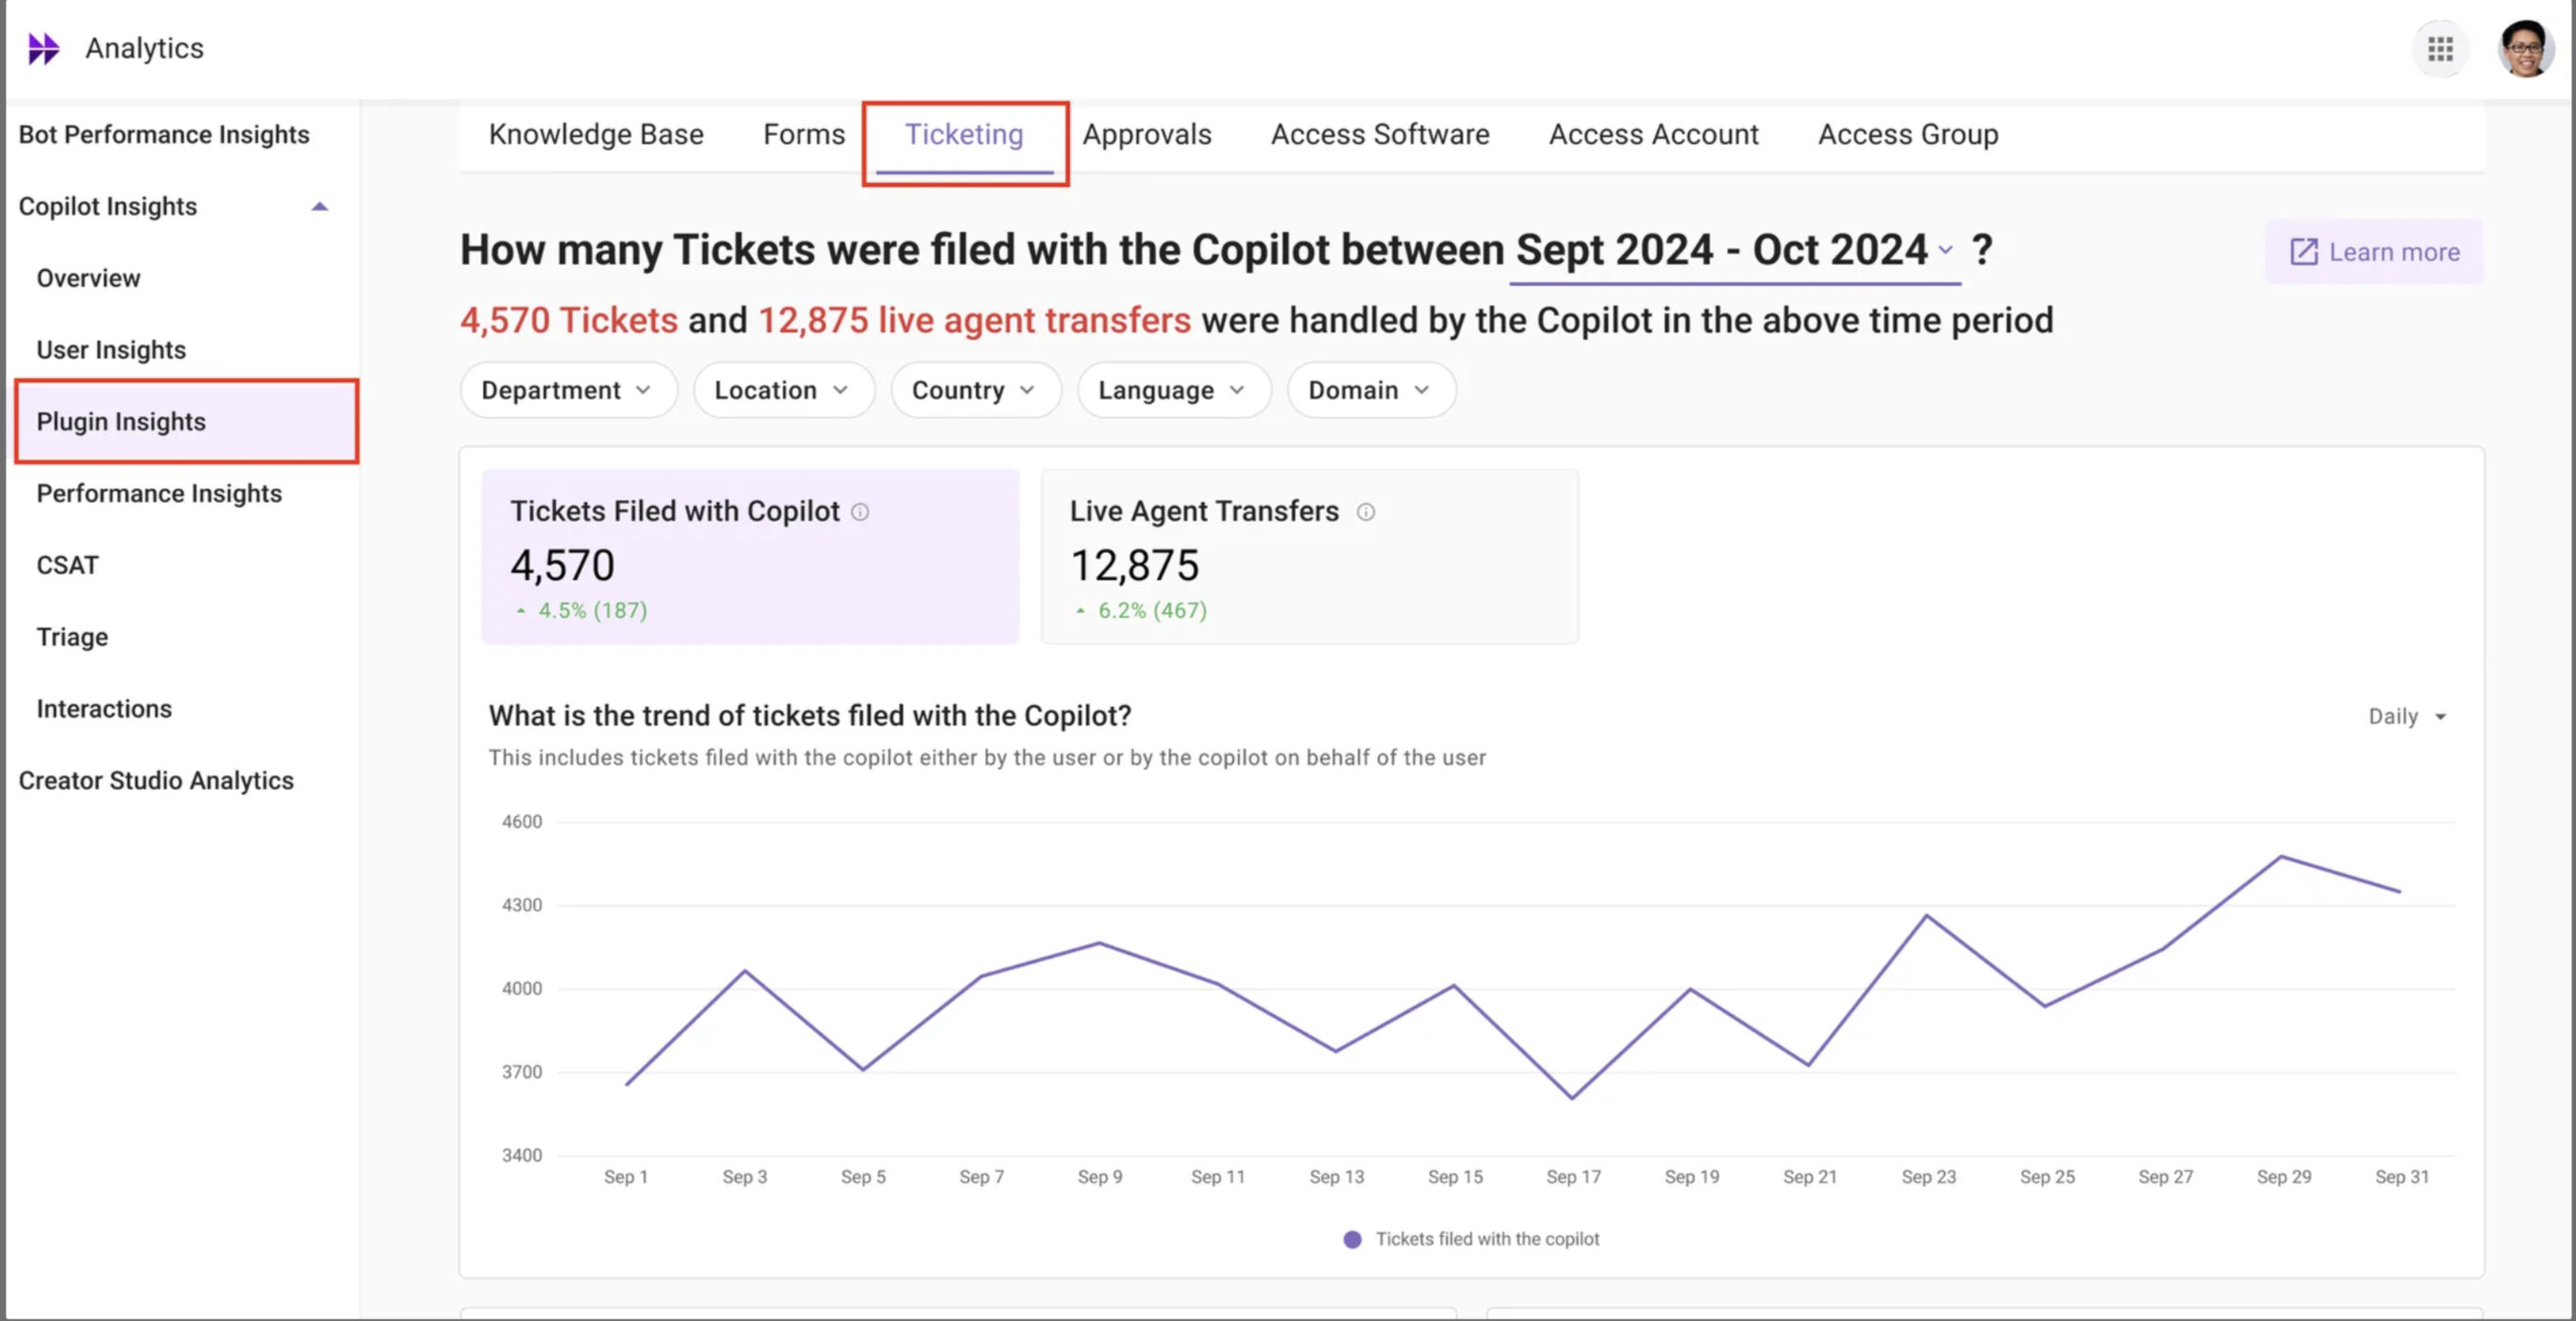
The Ticketing Insights report is a new addition to the Plugin Insights tab, located adjacent to the Knowledge Insights report. You can access this dashboard by navigating to the Plugin Insights section within the Analytics application on the navigation sidebar.
Users with a “Bot analytics admin” or “Bot analytics viewer” role for the analytics application can access this report. Please add the users using the Roles and Permissions tool if they cannot see this report under the AI Assistant insights tab.
Users with a “Bot analytics admin” or “Bot analytics viewer” role for the analytics application can access this report. Please add the users using the Roles and Permissions tool if they cannot see this report under the AI Assistant insights tab.
Key terms used in the dashboard
| Key terms | Definition |
|---|---|
| Tickets filed with AI Assistant | Tickets that are being filed through AI Assistant. These can be the tickets that the user is filing in cases where they did not find the AI Assistant response helpful or AI Assistant is filing the ticket for tracking purposes based on the configured workflows. |
| Live agent transfers | Users can also be handed off to a live agent by either allowing the agent to directly communicate with the user through AI Assistant or deflecting the end user to an external live chat platform. |
| Ticket Type | The type of ticket that is being filed. Incidents are generally used for break/fix type issues, whereas service requests are filed to fulfill user requests such as "Request a new laptop." Please refer to the ticketing configuration in Moveworks Setup to learn more about ticket types. |
| User-initiated ticket | Ticket filing initiated by the user by either accessing the "Get Help" option or directly asking AI Assistant to file a ticket. |
| Bot-initiated ticket | Ticket filing initiated by AI Assistant as part of the configured workflow. For example, access software workflows generate a Bot-initiated ticket. |
Filters and widget types
The Ticketing insights report allows you to filter AI Assistant adoption data for a selected time period, department, location, country and based on user preferred language.
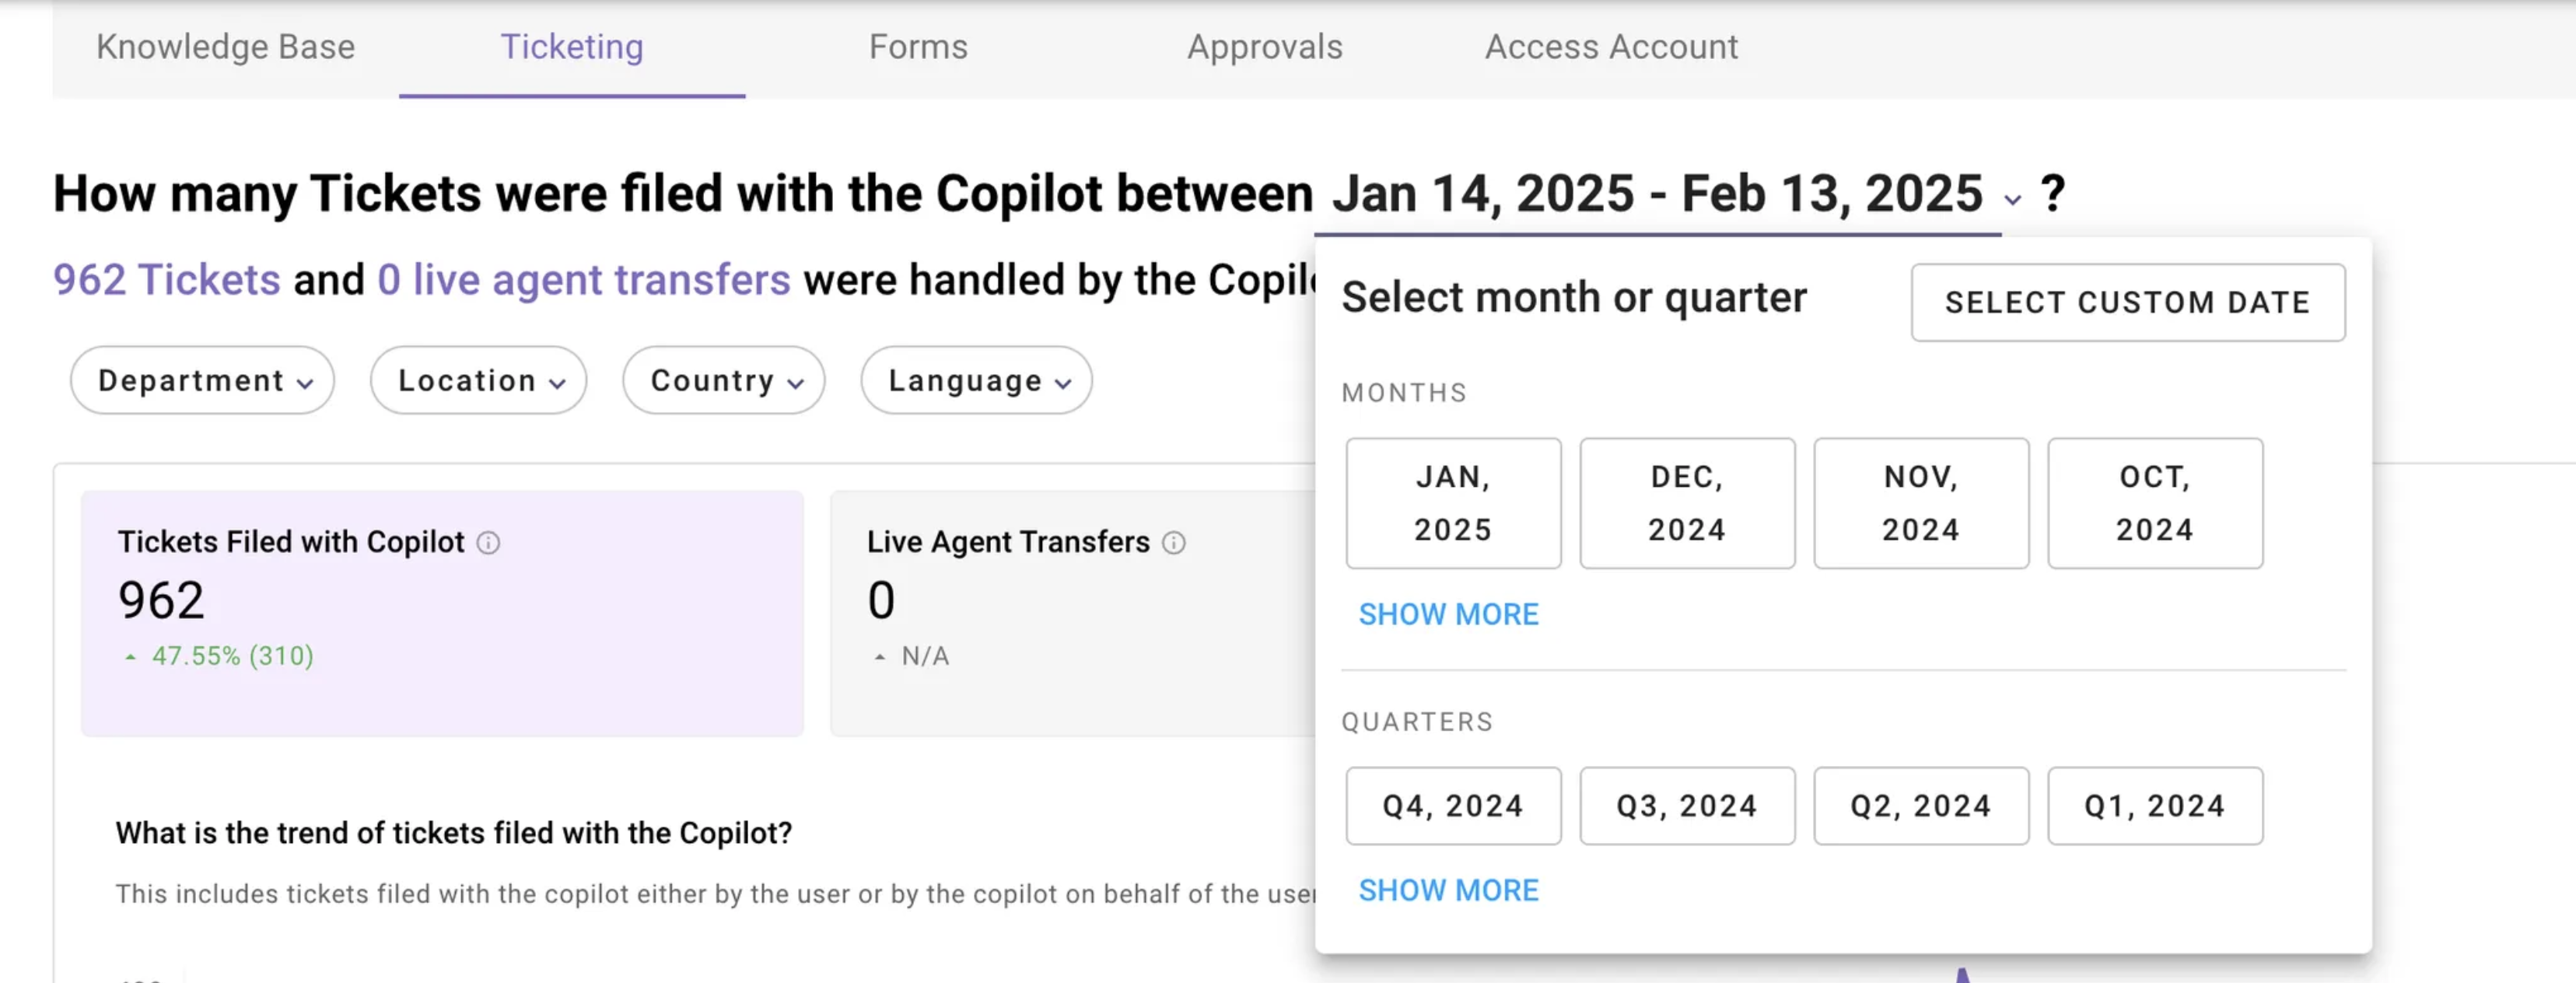
Select date interval for which you want to review the served content details
By default the dashboard show tickets filed/ live agent transfers done for previous 30 days. This can be changed using the date interval selection. You can select previous months (or) quarters using the selection available in the dropdown.
The dashboard also allows custom date interval selection. You can access that using the “select custom date” button.
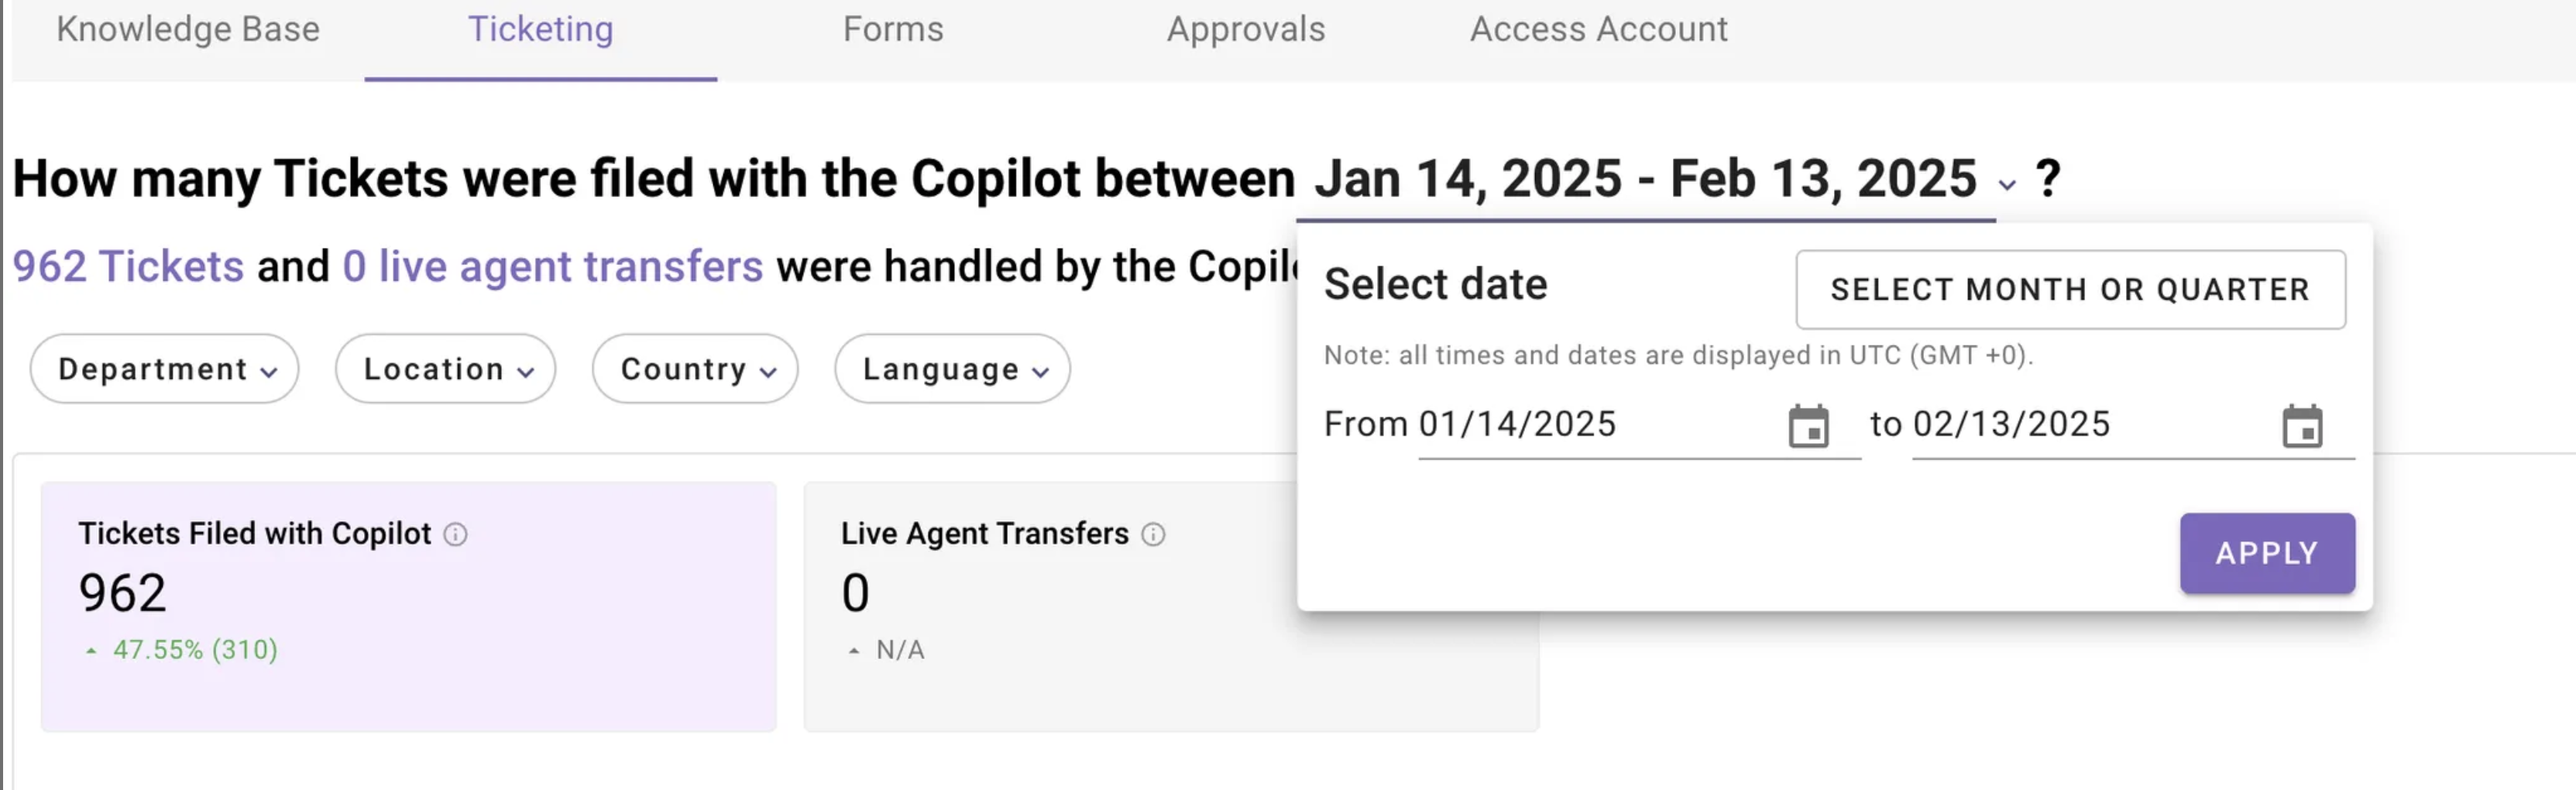
Please note the report data will be projected up to one day before the chosen end date.
Select department/ location/ country/ language for which you want review the served content details
Ticketing insights report provides 4 top level filters which can used to filter the data
The department/location/country value is ingested from your external system used in user identity. Please refer here to learn more on user identity ingestion.
Widget types used in this dashboard
- Trend chart
Line chart or Bar chart that presents the values of one or more metrics over a period of time, with selectable time intervals (day, week, month). For example: trend of active user over a selected time interval.
The day, week, month breakdown is only visible for a selected time interval
| View type | Minimum time interval | Maximum time interval |
|---|---|---|
| Daily | 1 Day | 30 Days |
| Weekly | 2 Weeks | 26 Weeks |
| Monthly | 1 Month | 24 Months |
- Table
A tabular list of one or more dimensions and their metrics.
- Bar chart
A graphical chart that presents the value of one metric for each value of a dimension on horizontal or vertical bar chart. For example: Served content volume, this chart shows the total number of content being served by AI Assistant based on a daily/weekly/monthly breakdown.
Deep-dive into widgets
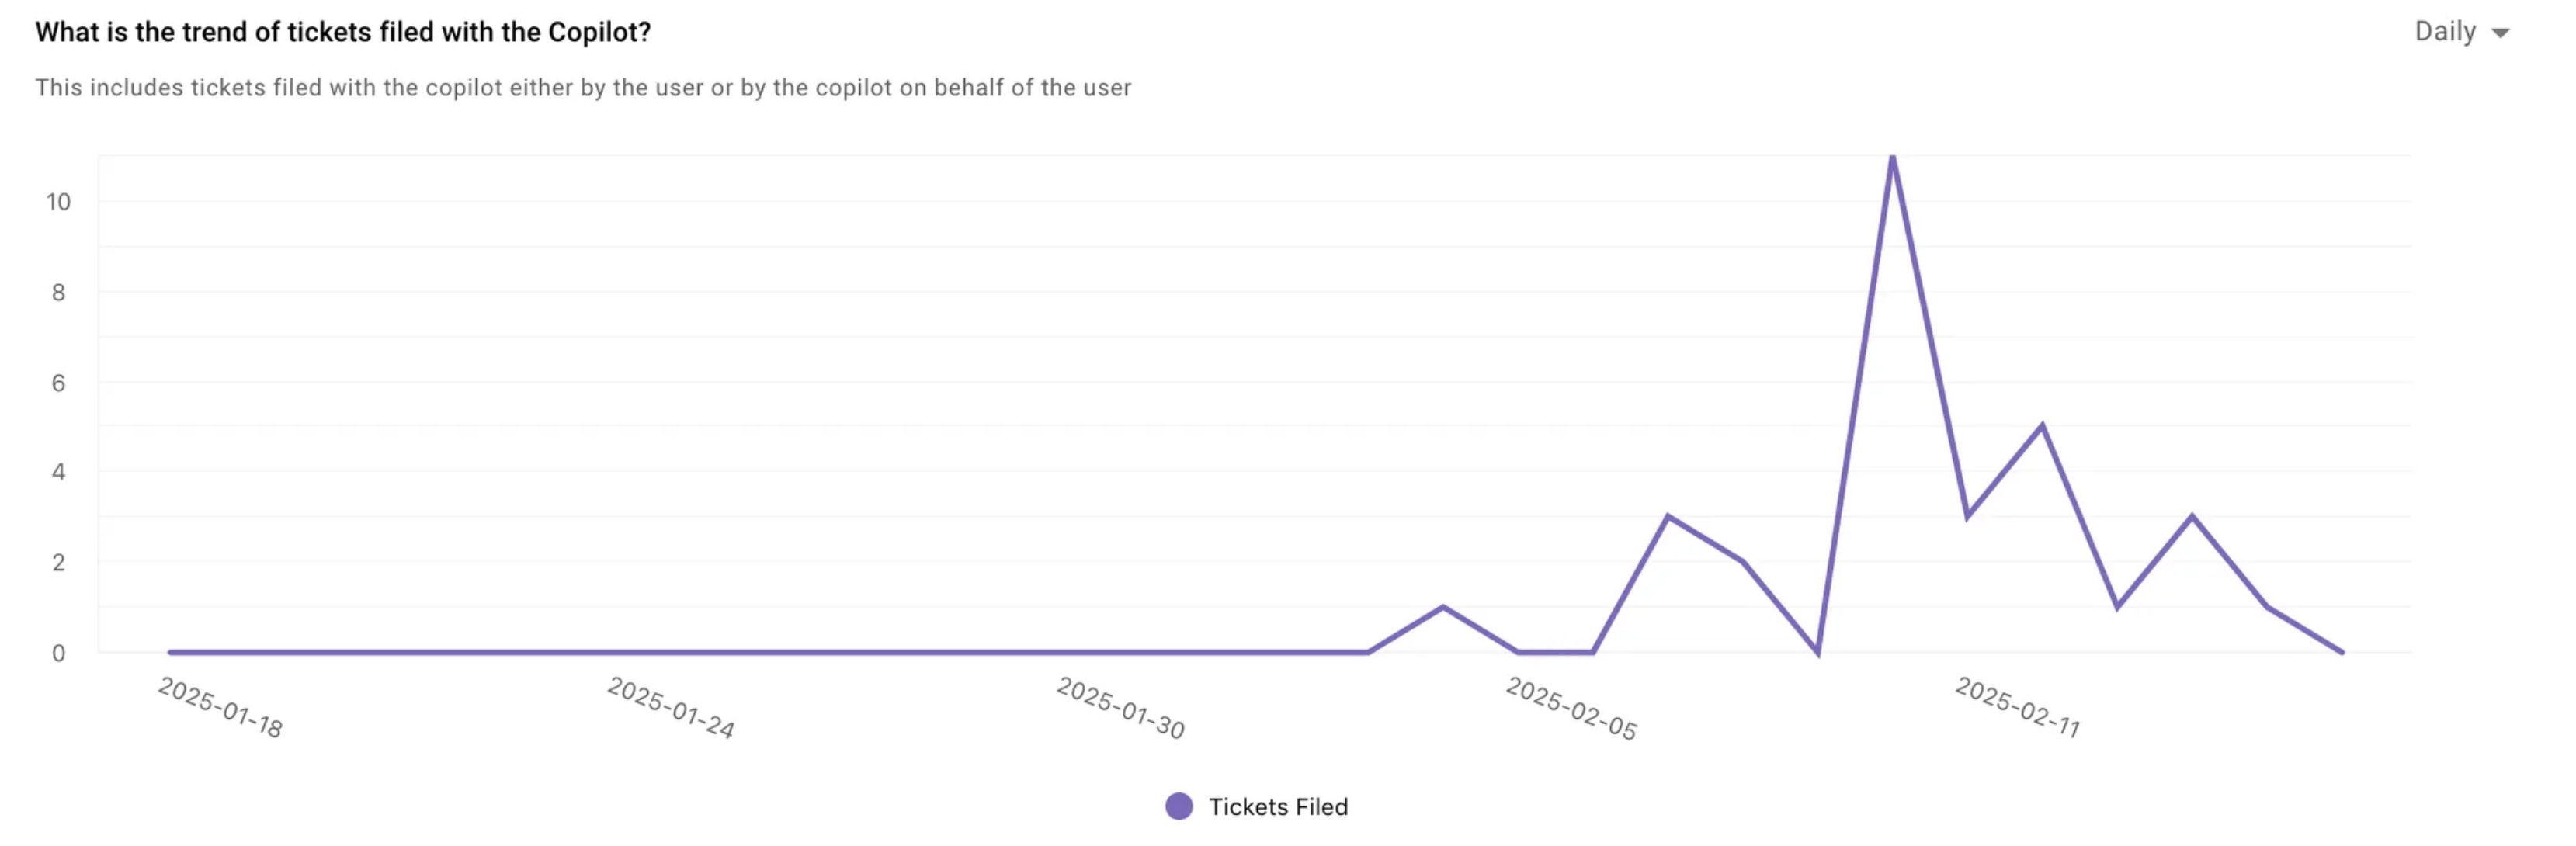
Trend of ticket getting filed through AI Assistant & live agent transfers
This widget shows the volume and trend of tickets being filed through AI Assistant, as well as live agent transfers handled through AI Assistant. The trend chart provides a distribution by day, week, or month for the selected time period, helping you understand the volume redirected to your service desk through AI Assistant.

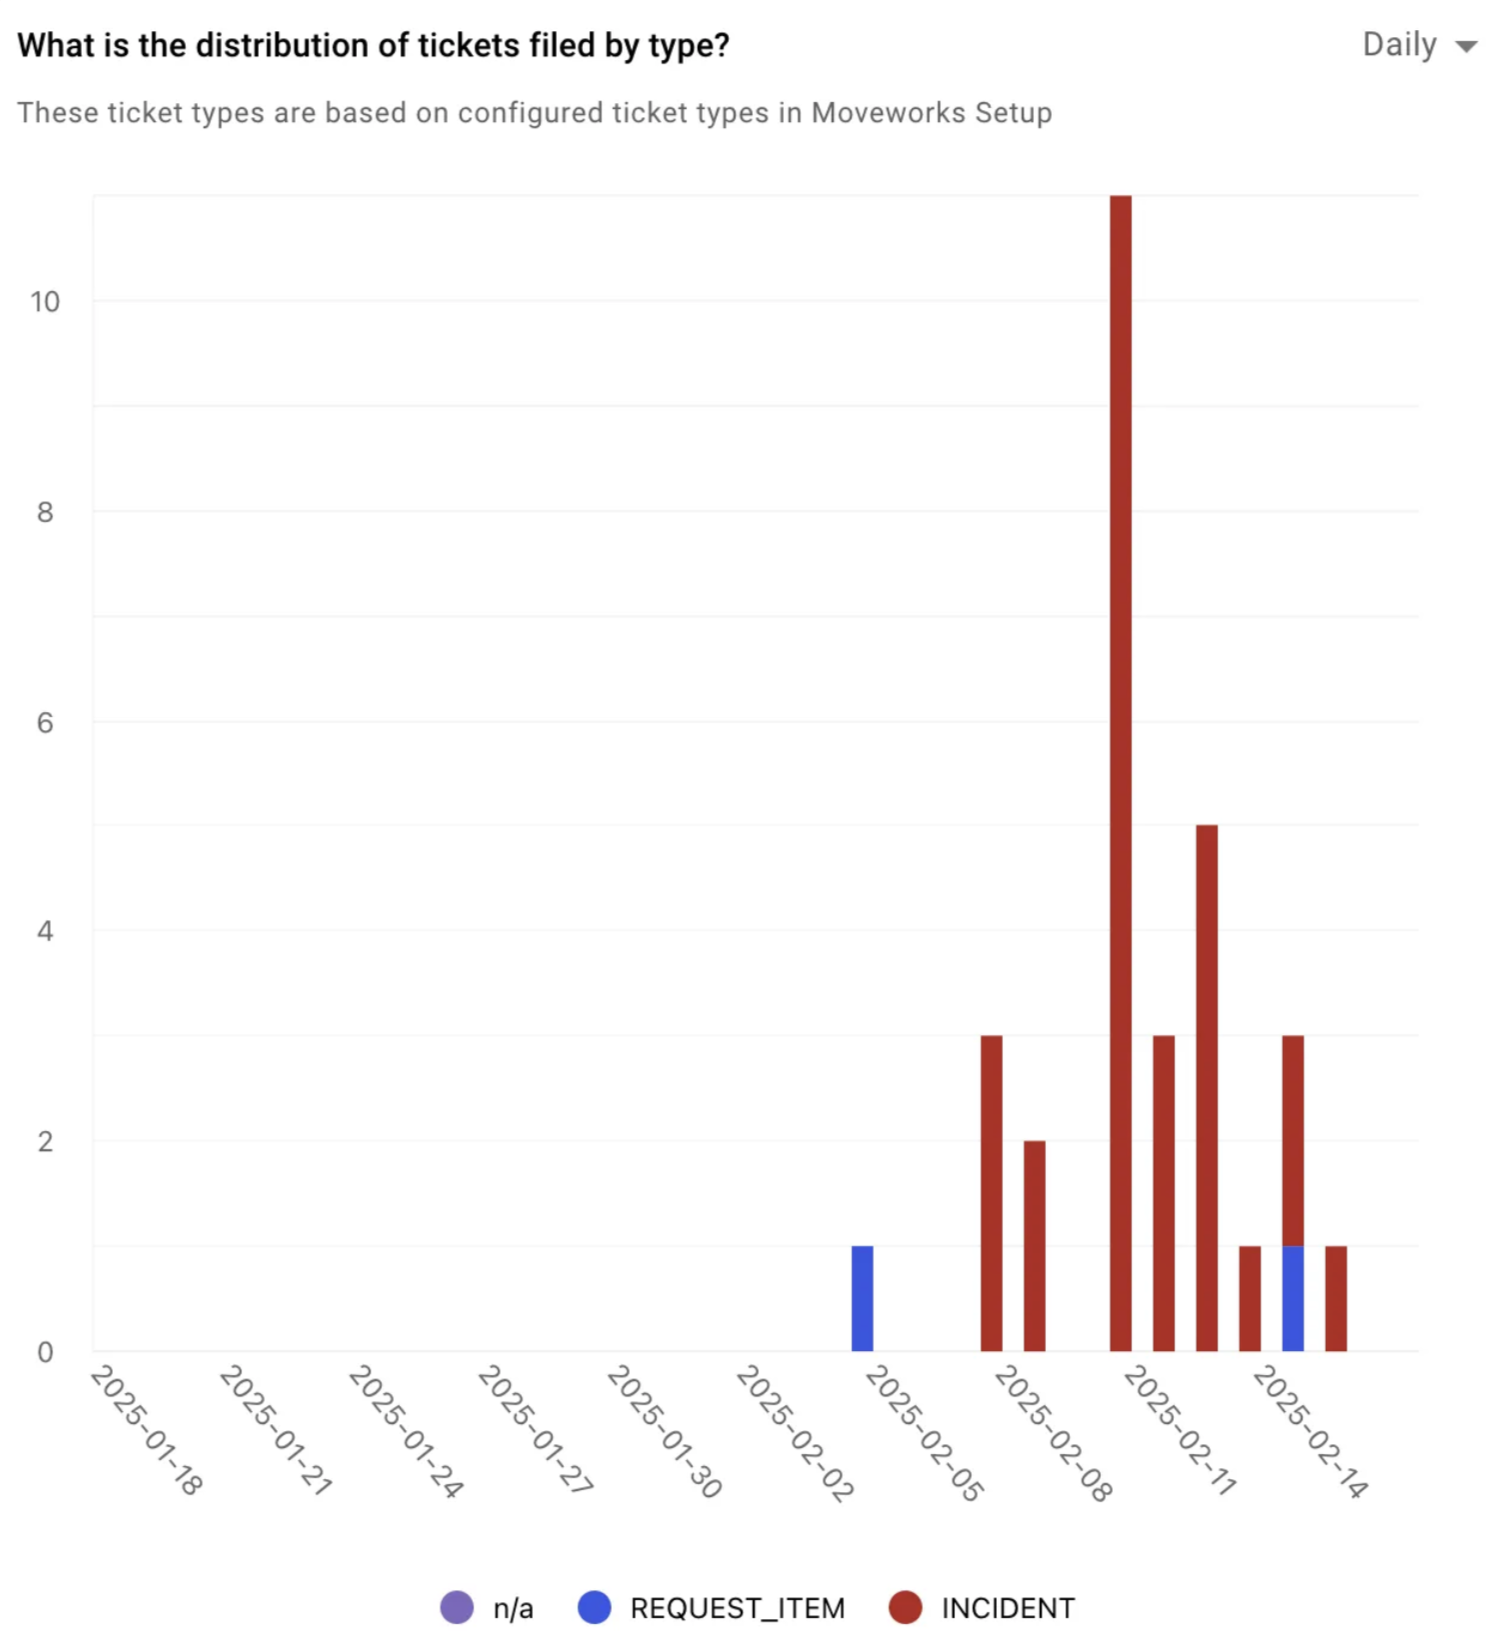
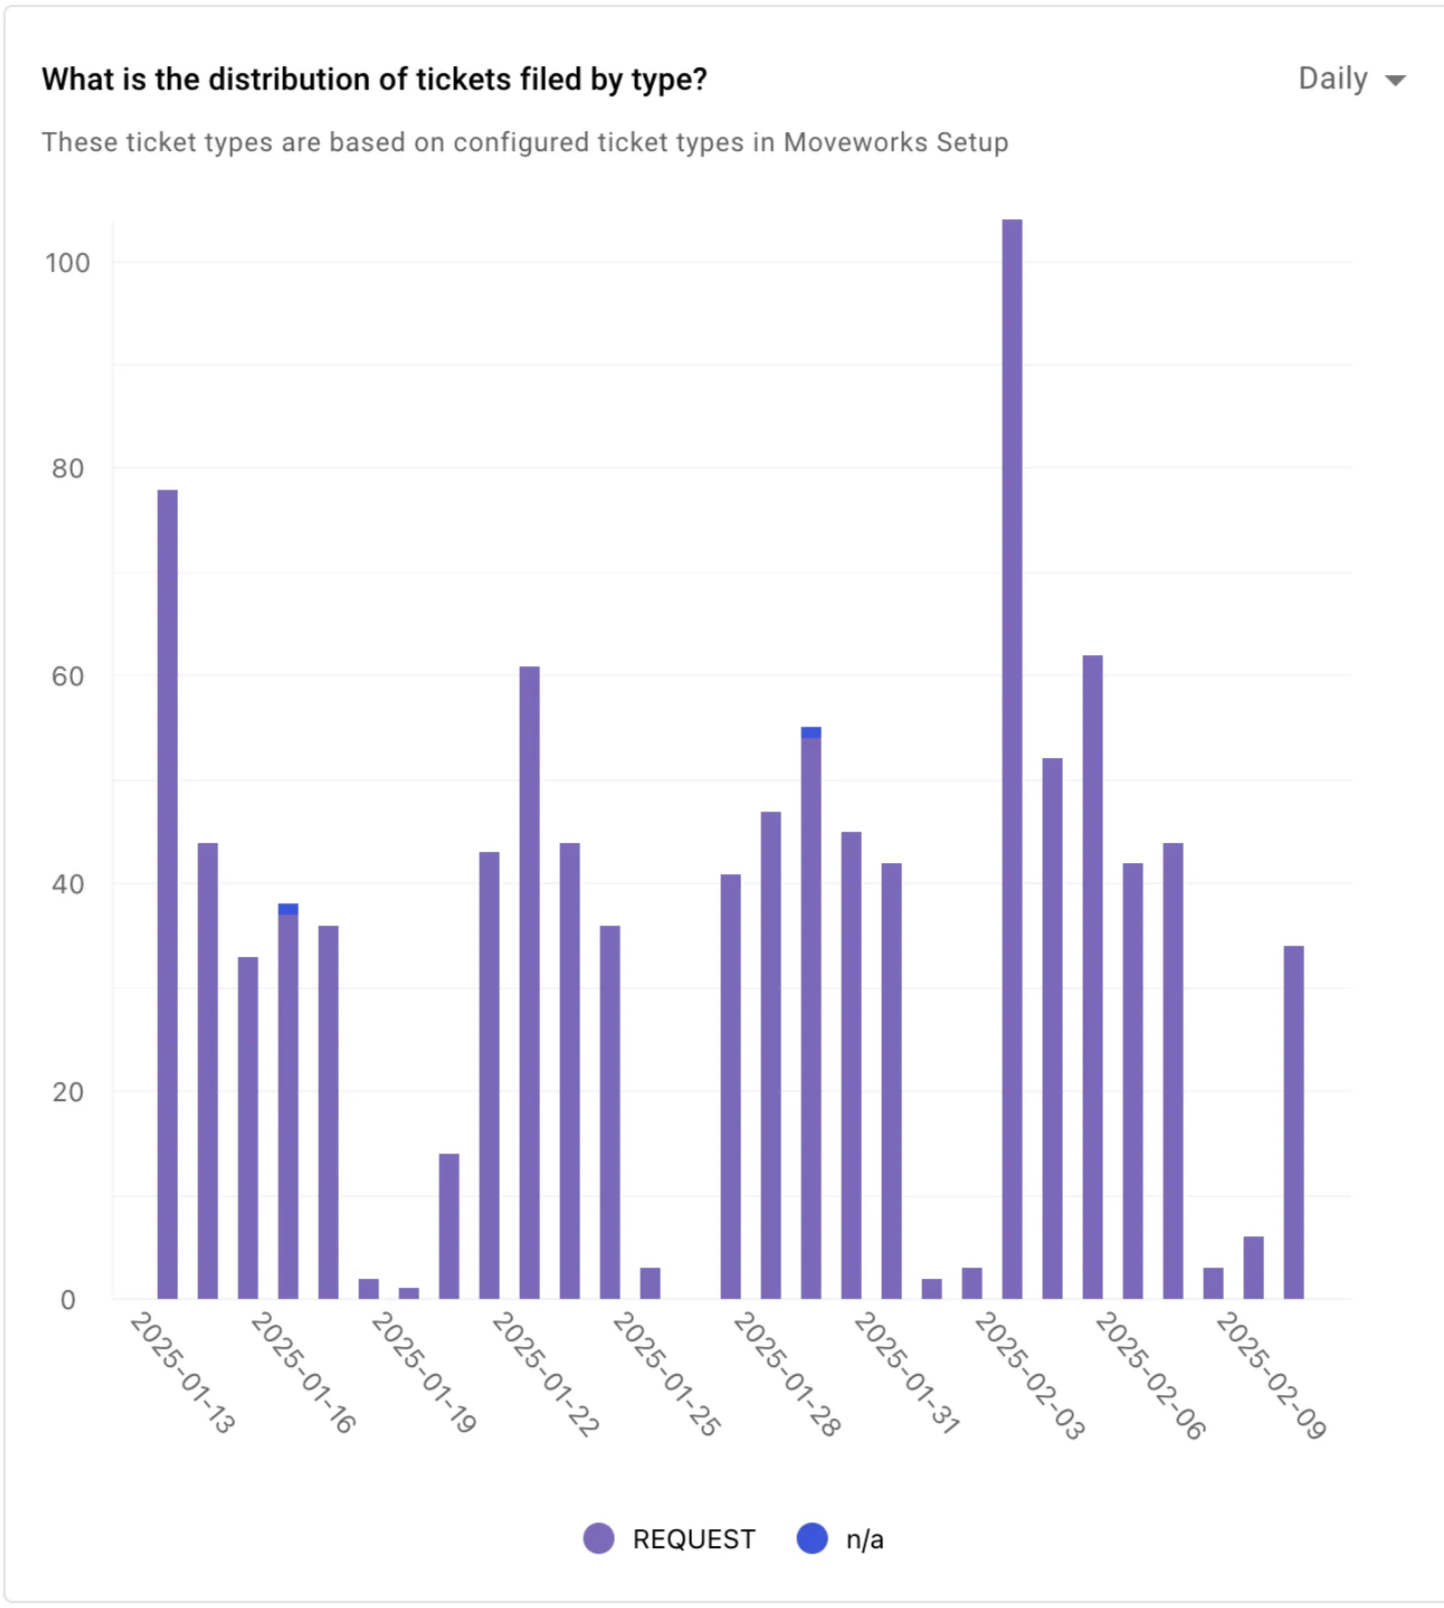
Distribution of tickets filed by ticket type
This distribution provides insights into the types of tickets being filed through AI Assistant over a period of time. The bar chart offers a distribution by day, week, or month for the selected time period. This widget reflects the ticket types configured in the Moveworks Setup product for all ticketing destinations, giving you insights into the volume of each ticket type.
This widget can contain "n/a" for ticket types. Tickets can be dropped while being polled from the Moveworks side, resulting in an inability to determine the ticket type. This issue is observed in only 1% of tickets.
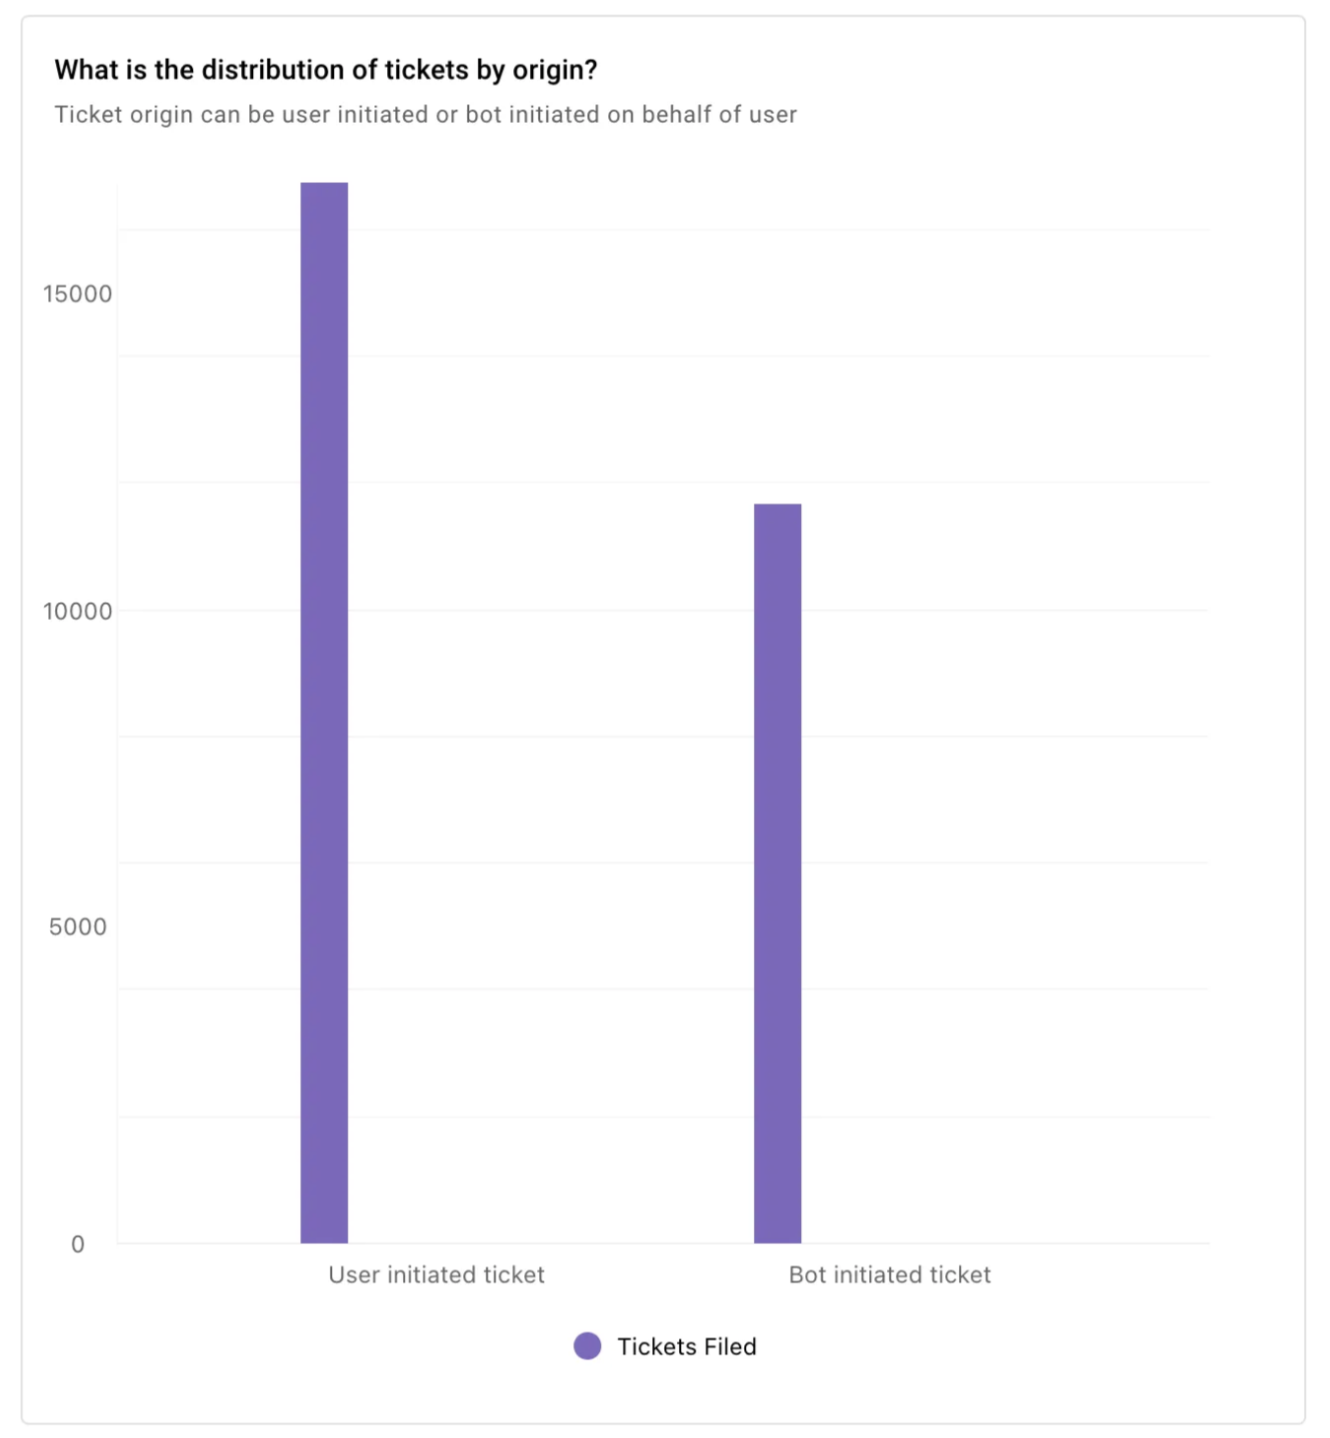
Distribution of ticket by origin
AI Assistant allows the filing of tickets in primarily two types: user-initiated tickets and bot-initiated tickets. User-initiated tickets are those filed by the end user by either accessing the "Get Help" option or directly asking AI Assistant to file a ticket for them. Bot-initiated tickets are filed by AI Assistant at the end of workflows such as software provisioning or MFA reset. These tickets result from automation enabled through Moveworks skills.
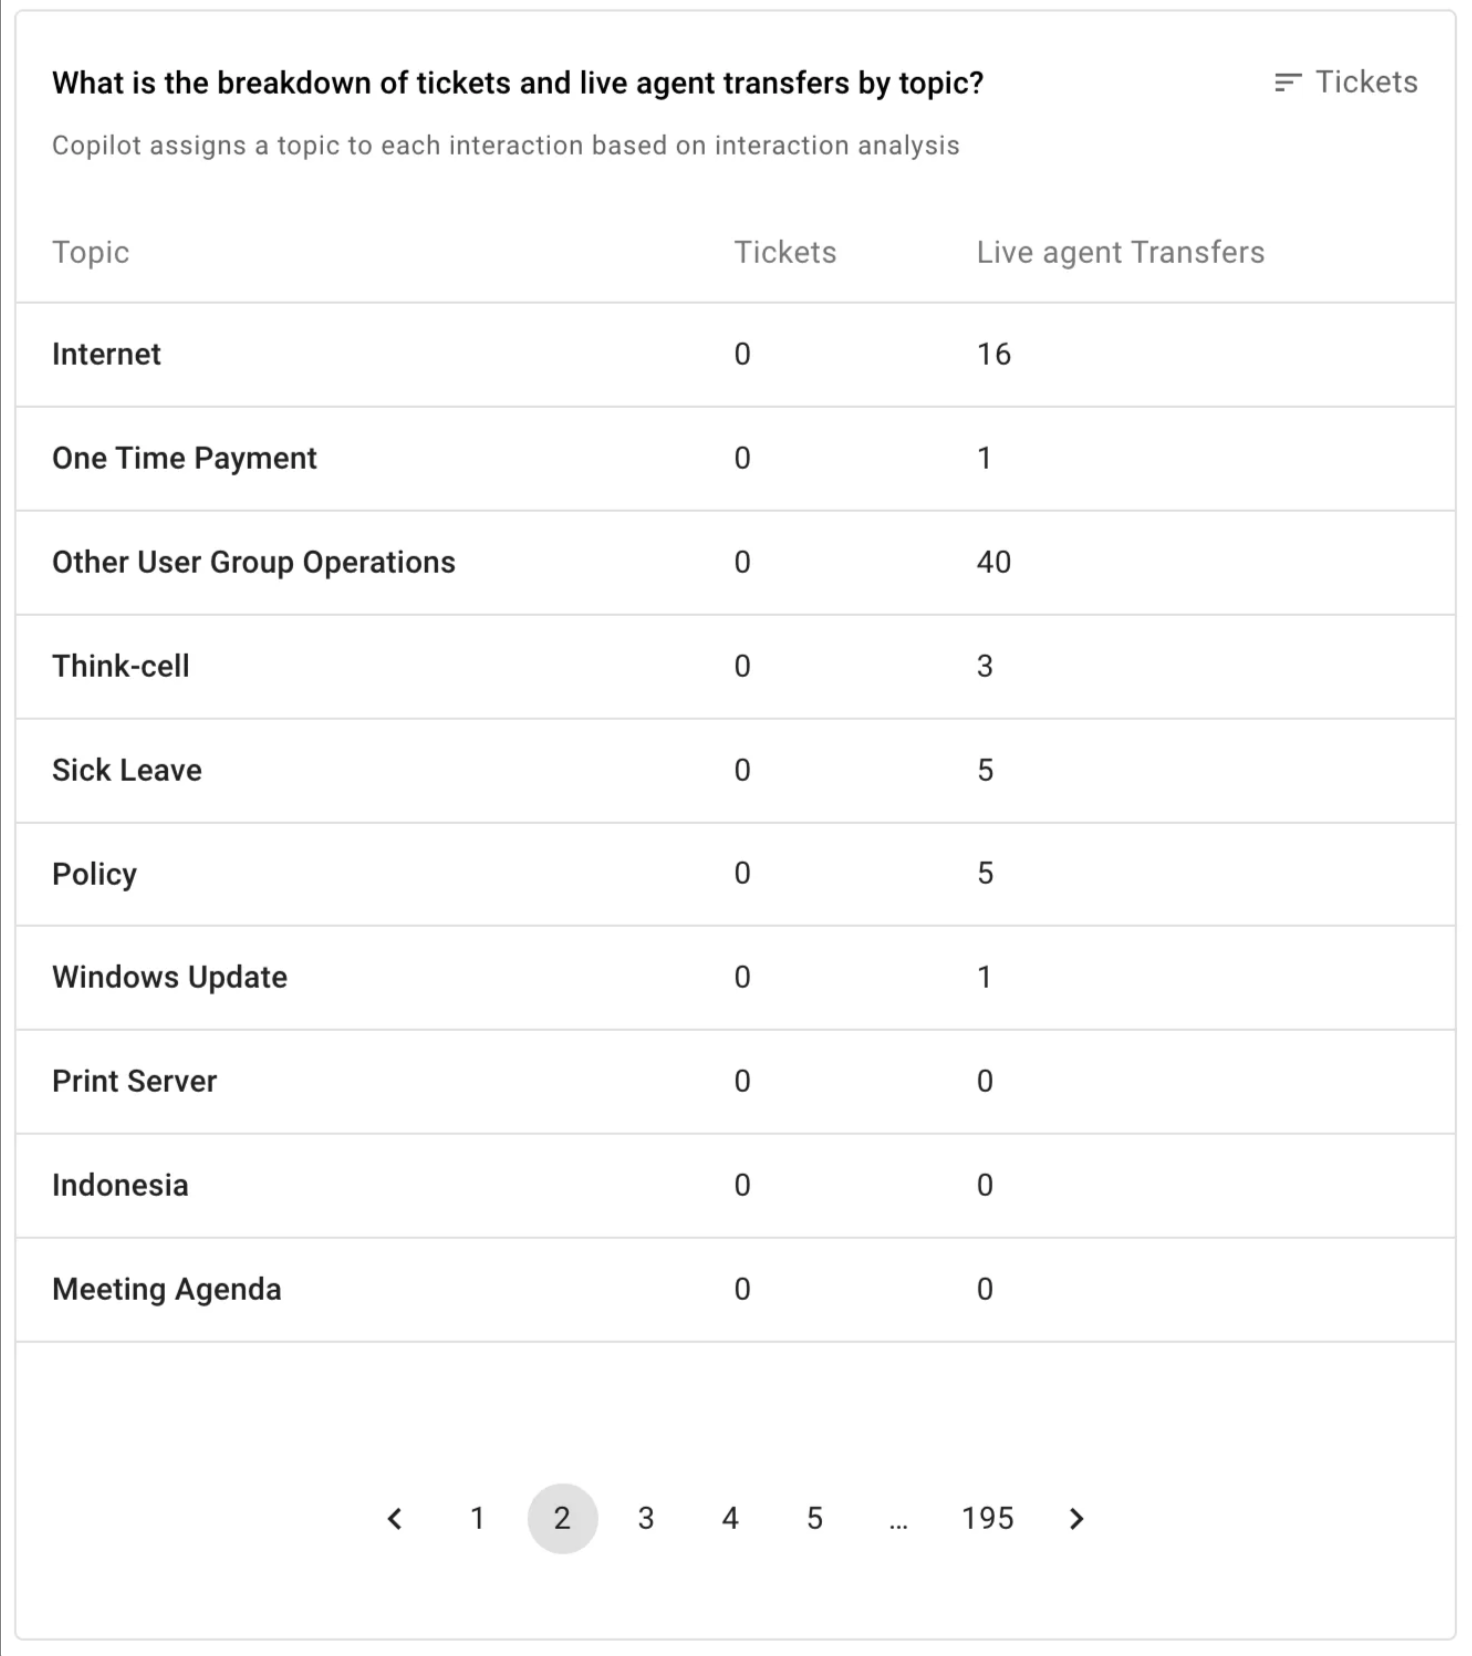
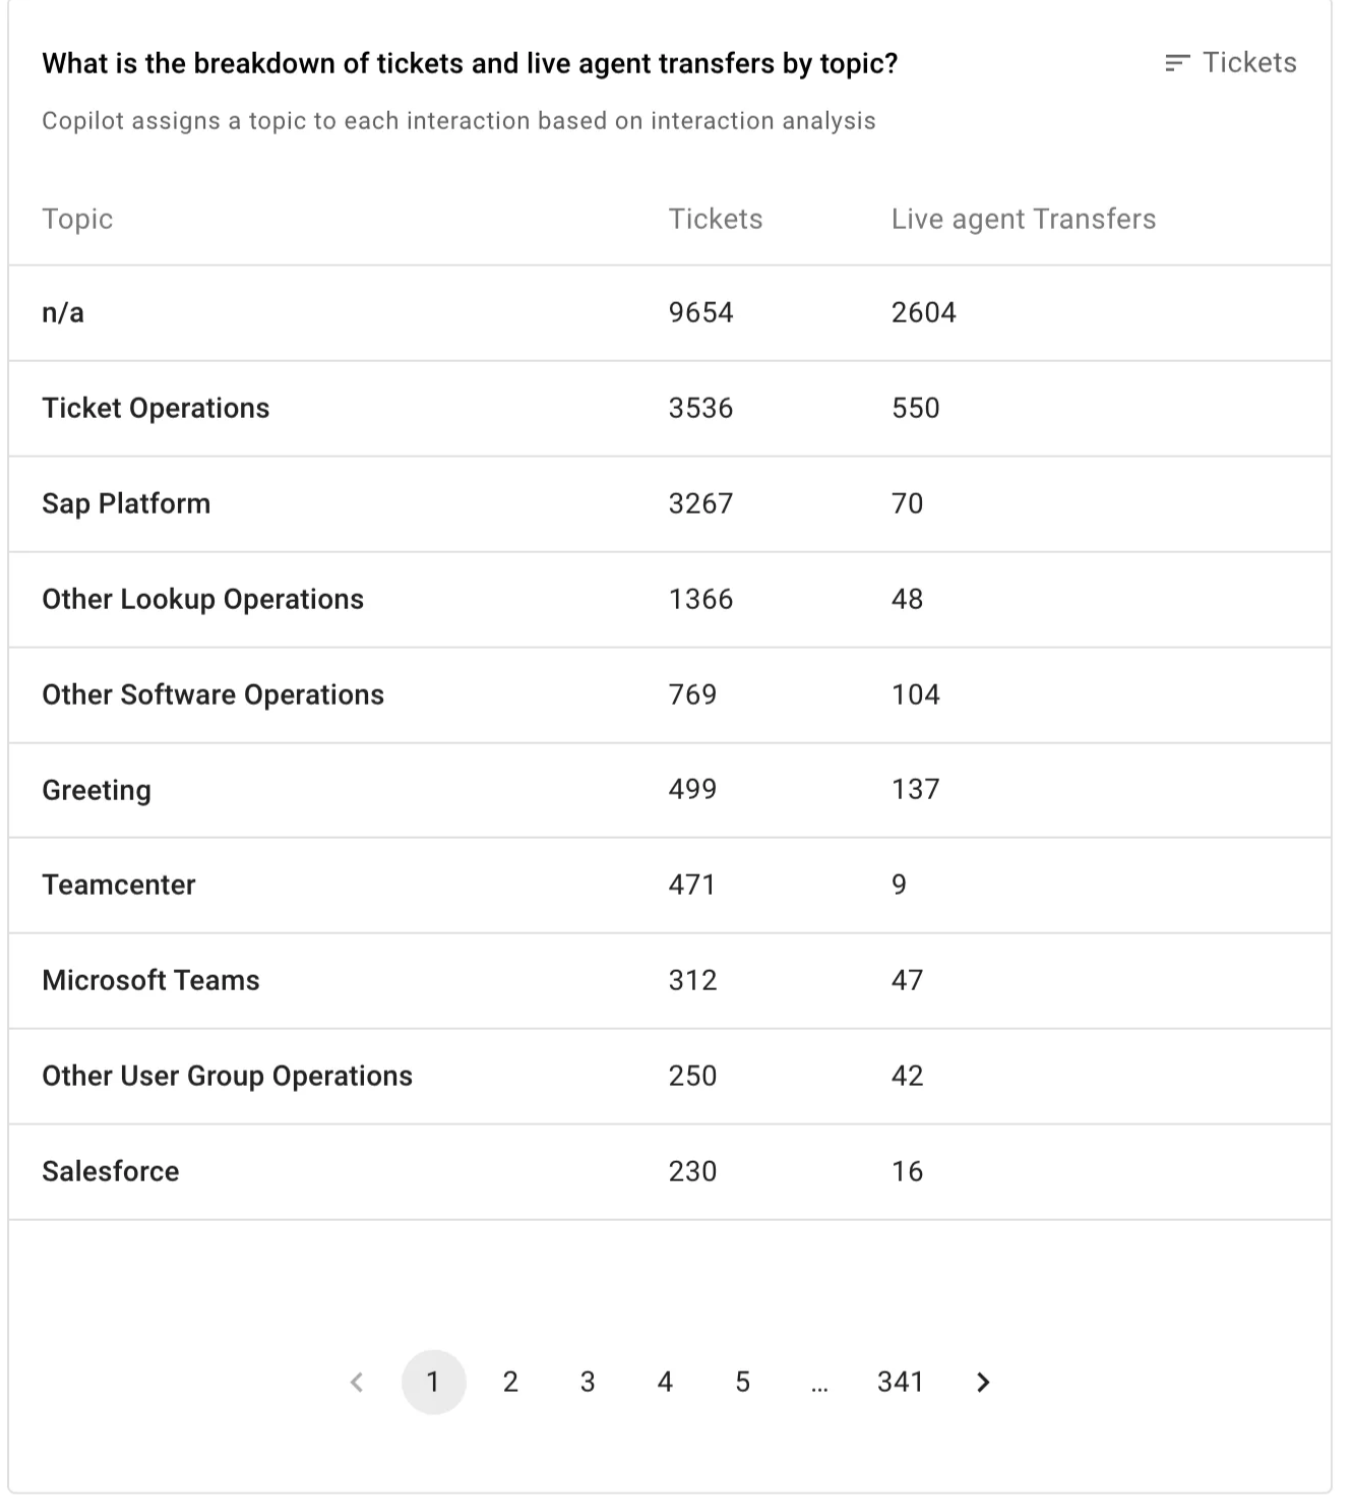
Breakdown by Topic/ Domain
The breakdown of tickets filed through the AI Assistant, live agent transfers through AI Assistant on the topic and domains provide more information on why the users are reaching out to the service desk instead of self-serving their issues. The topic & domain is predicted at an interaction level by understanding the User Utterance.
This widget allows you to sort based on the number of tickets getting filed or live agent transfers column.
Please note the “tickets” column contains both User initiated & Bot initiated tickets.
The topic & domain prediction is going through a revamp on the Moveworks end. We are moving the topic & domain prediction at the conversation level which allows a better coverage and precision. This will be reflected in the dashboard in due time. You might see "n/a" currently in the widgets.
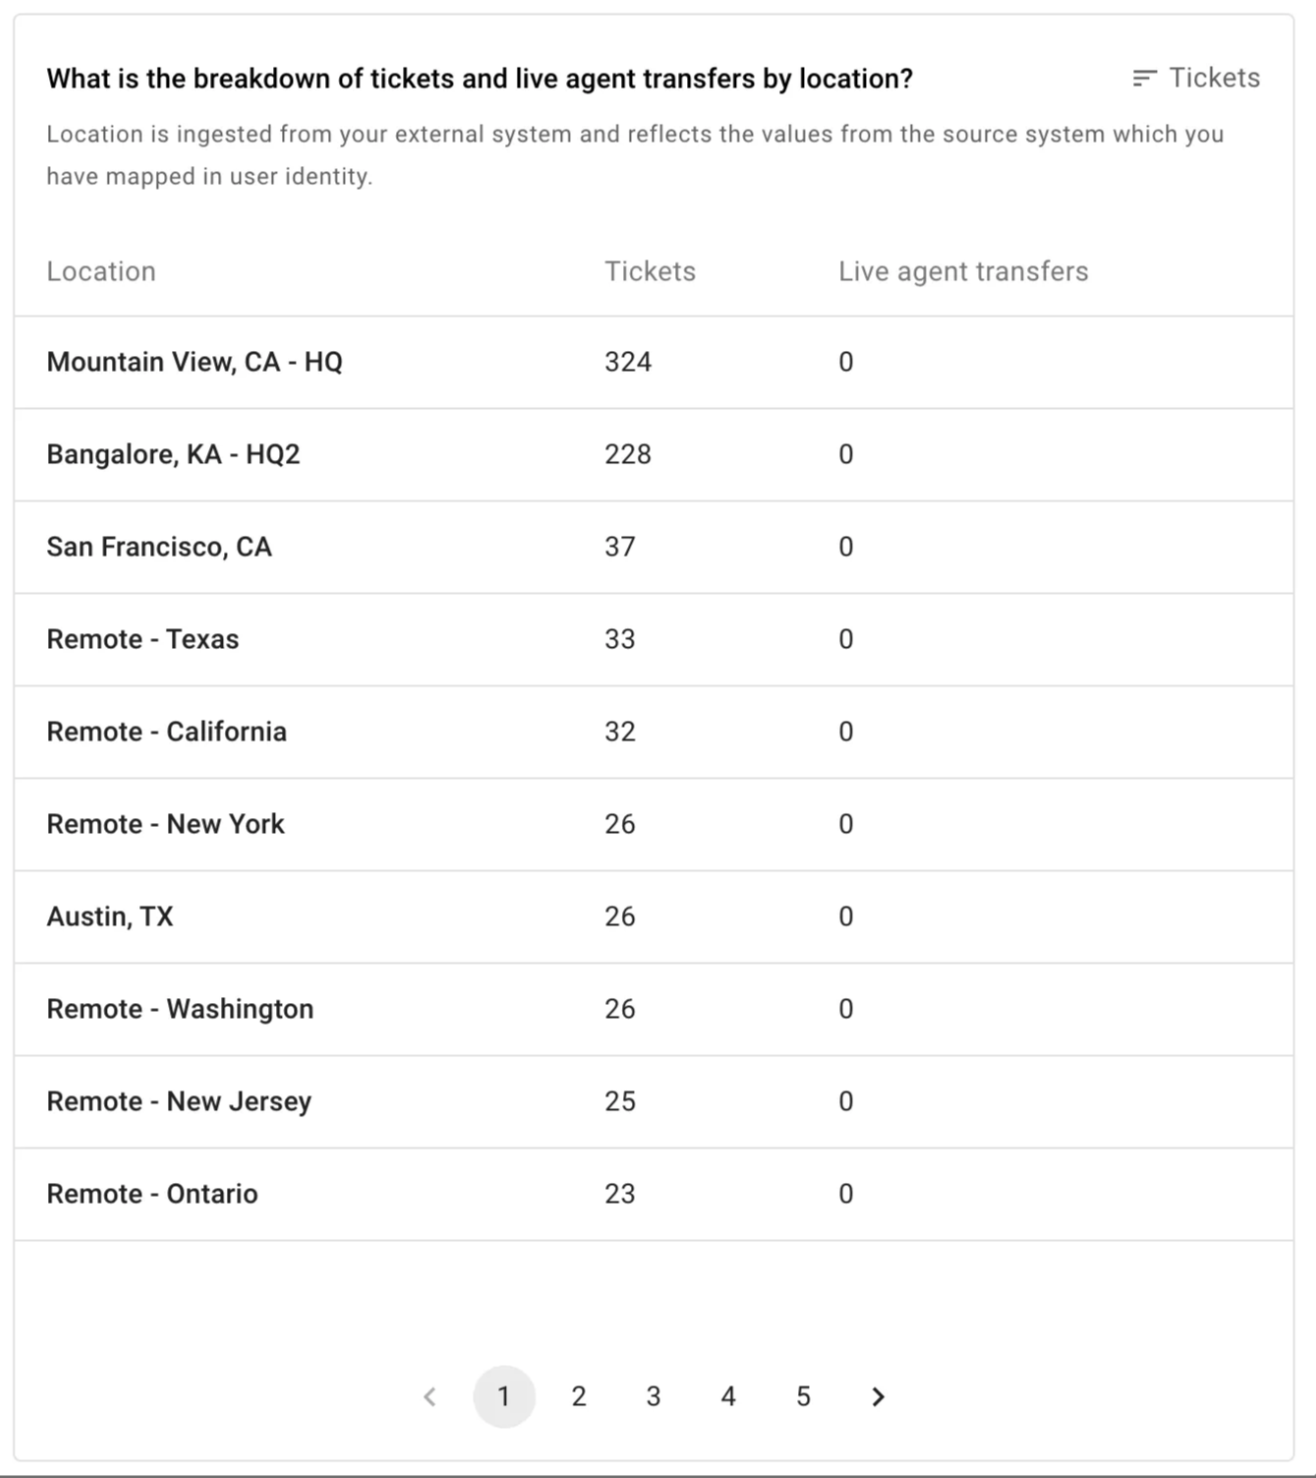
Breakdown by Department/Location
The breakdown on department and location provides an insight into which type of users are reaching out to the service desk instead of self-serving their issue. The department and location data is pulled from your identity systems.
Please note the “tickets” column contains both User initiated & Bot initiated tickets.
What are the key questions i can answer using this dashboard ?
My service desk is facing a huge volume of incoming request, in what areas AI Assistant is lacking? How do i learn what are my users asking the AI Assistant?
Service desk escalation through AI Assistant can happen in two ways: either the end user is filing a ticket and connecting with a service desk agent, or they are being transferred to a live agent. The Ticketing Insights dashboard covers these details comprehensively.

-
If you see a large increase in volume based on the period-over-period comparison, the next step is to understand what is causing this increase. The Ticketing Insights dashboard also covers these details and allows you to determine which topics led to more tickets or live agent transfers
The topic & domain prediction is going through a revamp on the Moveworks end. We are moving the topic & domain prediction at the conversation level which allows a better coverage and precision. This will be reflected in the dashboard in due time. You might see "n/a" currently in the widgets.
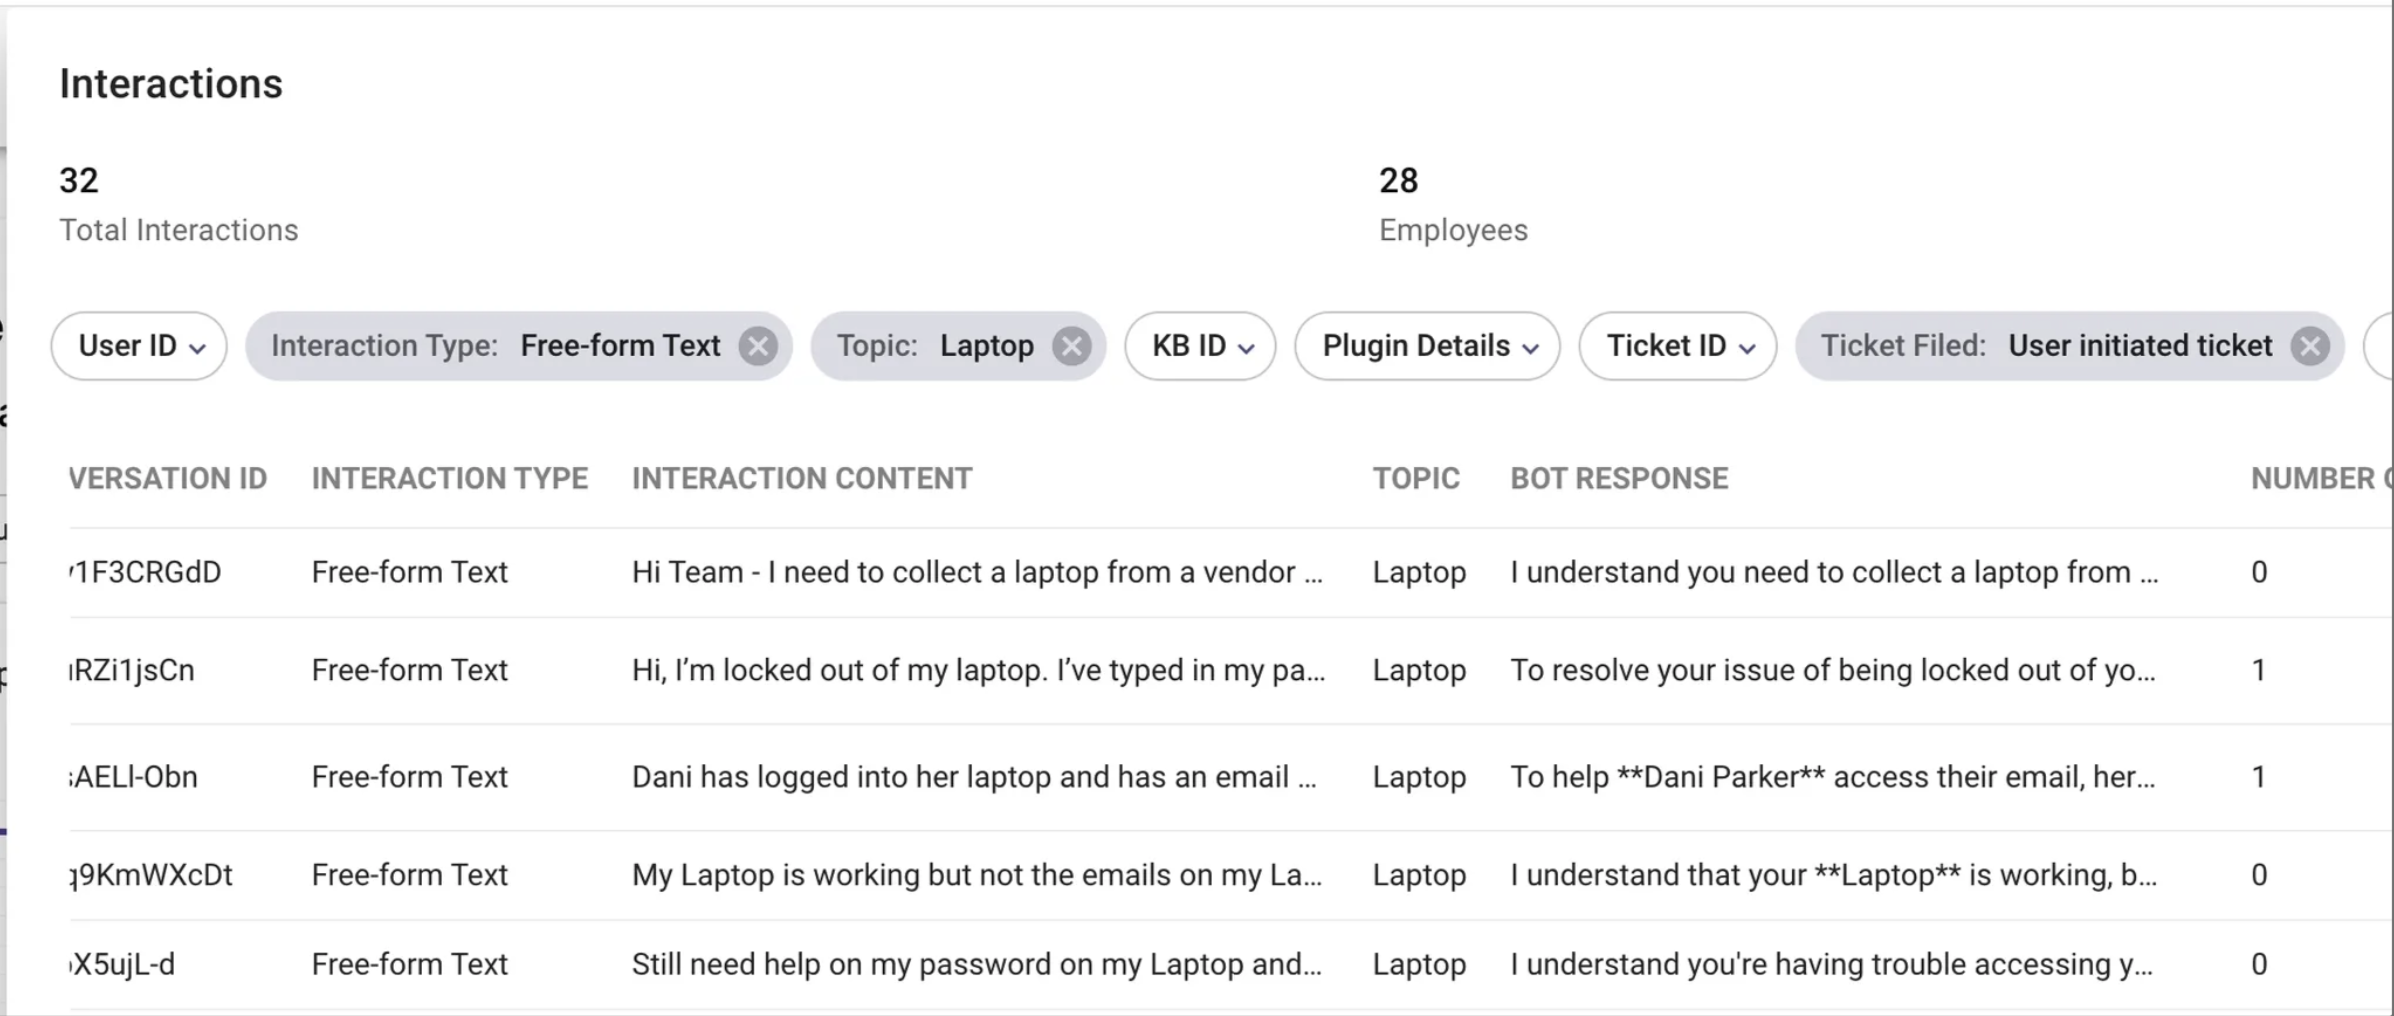
These topics are detected from user utterances, but a deeper analysis of user utterances allows us to gain insights into "what areas my AI Assistant is lacking, what are they asking?" AI Assistant Insights also provides this capability, exposing raw user interactions on these topics when a ticket is being filed by the end user.
-
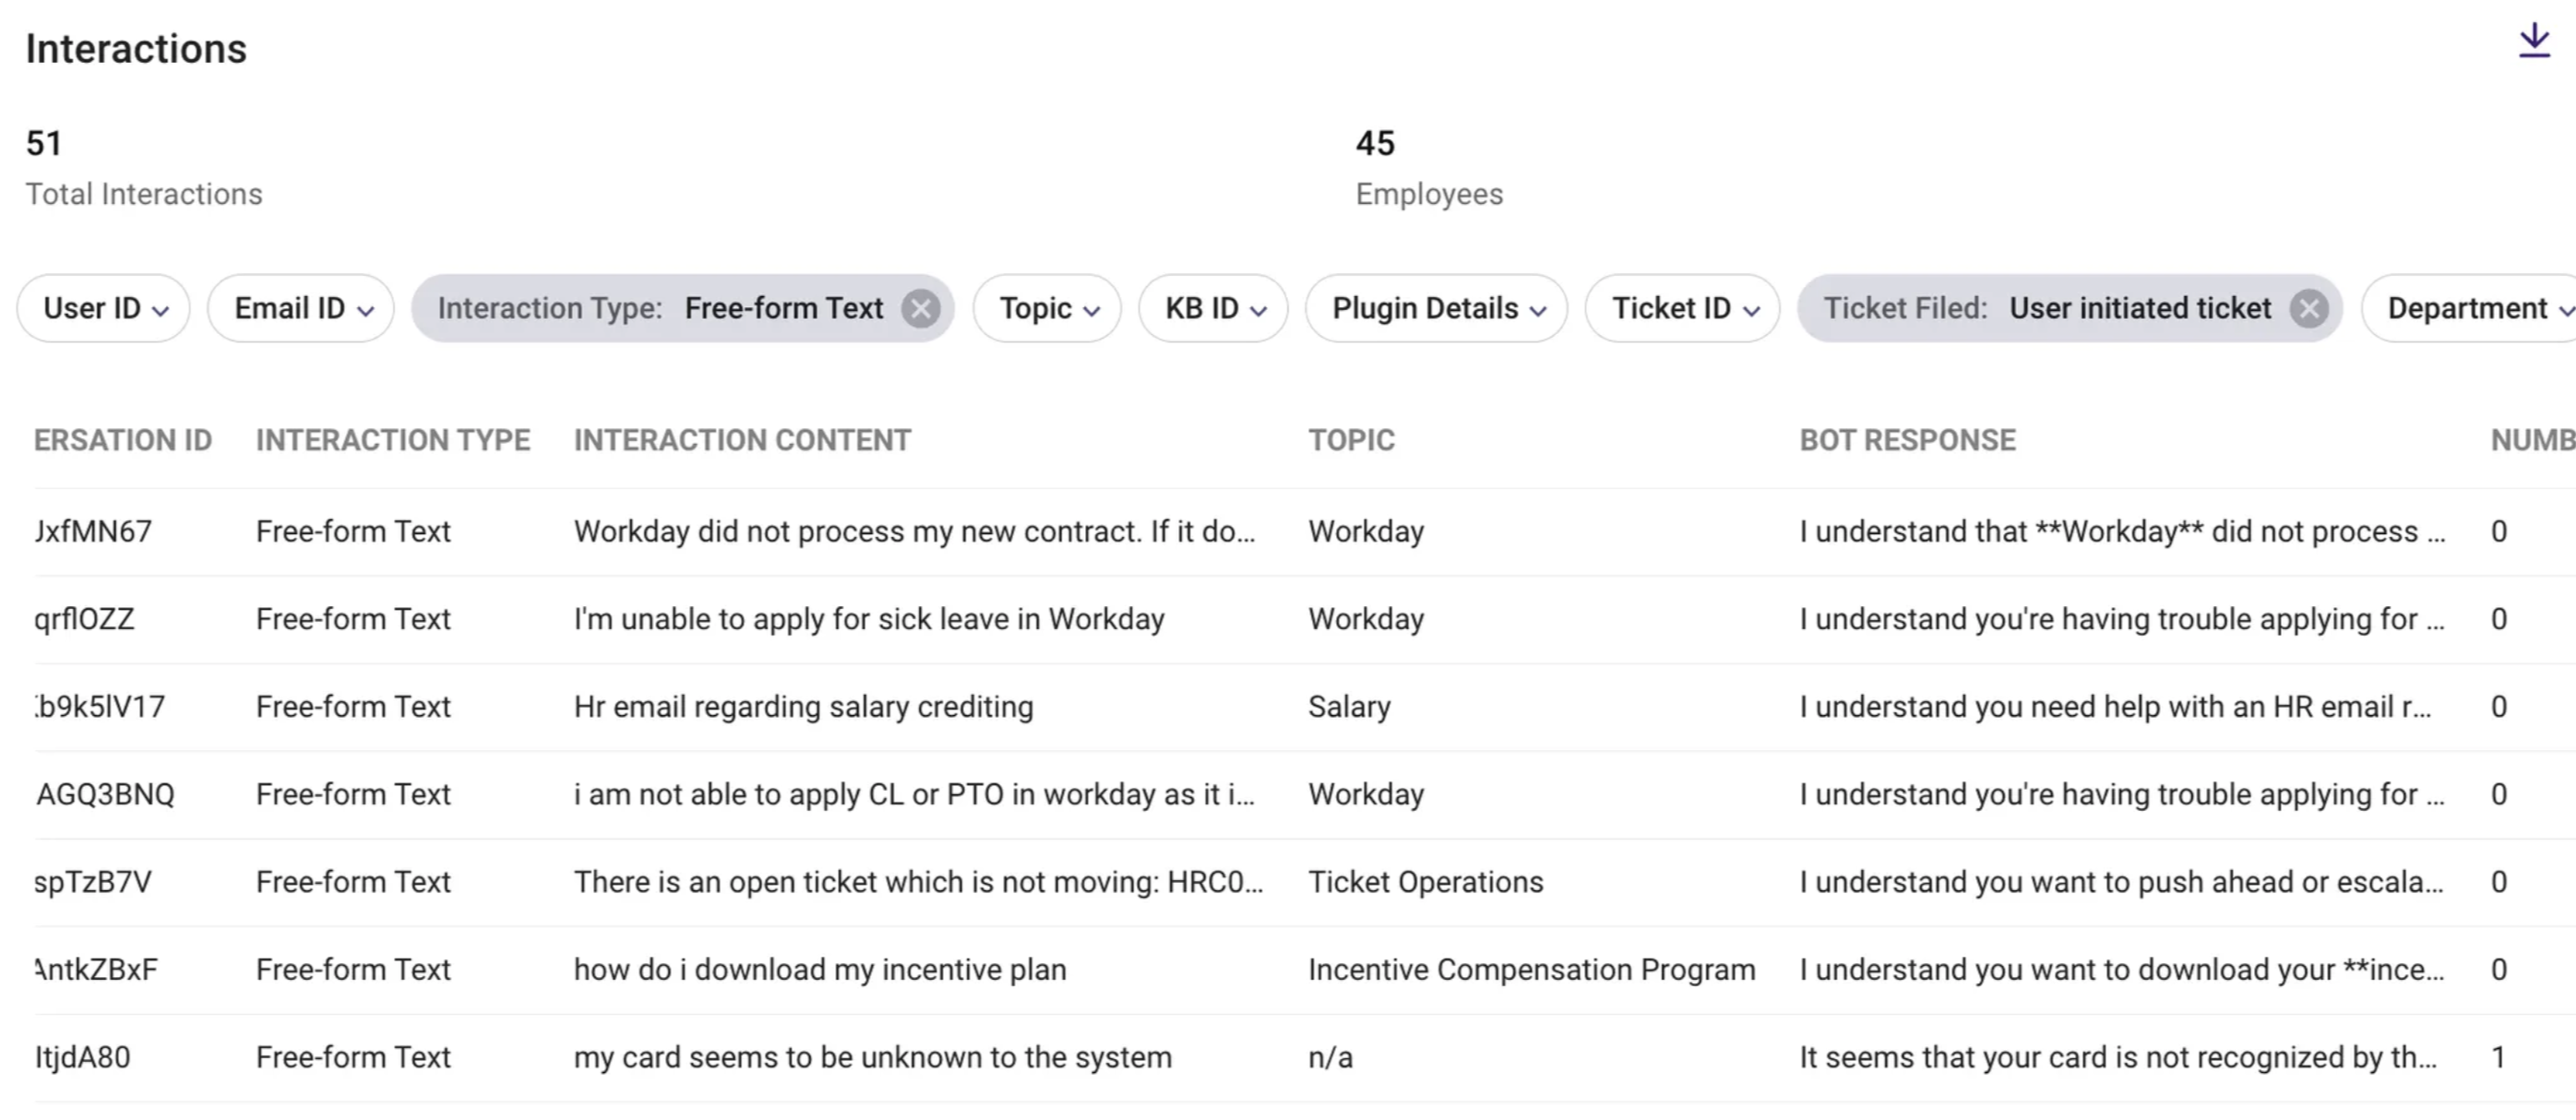
You can visit the interactions table under the "Overview" page and filter by "User Initiated Tickets", interaction type “Free-form Text” to read through them and export details related to these interactions.
We recently deployed HR ticketing, have my users started filling HR tickets through the AI Assistant? For which topics they are filing these tickets?
After deploying a new integration, such as Workday for ServiceNow ticketing in the HR domain, it is important to understand how users are filing tickets related to HR queries. This helps you identify where AI Assistant may be lacking in terms of HR self-service. Ticketing insights provides details on which domain are leading to more ticket generation.

The Ticketing Insights dashboard enables you to understand which domain is detected from the user utterance when they are filing a ticket. This allows you to determine if people are filing tickets for HR-related queries.
Once you understand the volume of tickets, the next level of analysis to perform is to identify which topics are leading to the creation of HR tickets.
-
You can get these details by visiting the "Overview" > "Interactions" table and filtering for interactions where there is a "User Initiated Ticket" and an "HR" domain. Filter out for “Free-form Text” to only read through the utterances.
Troubleshooting and FAQ’s
What is the data refresh policy on this dashboard?
AI Assistant conversation data is processed on a daily basis and is updated by 4:00 PM (PT) every day for the previous day's data. The demographic data, such as user department and location, is fetched from the user identity ingestion process, which runs approximately every 4 to 6 hours (Please note: The schedule for the identity ingestion pipeline can be configured differently for your organization).
Why this dashboard is not visible to few users?
Please ensure the user has the “Bot analytics admin” or “Bot analytics viewer” role to access the dashboard. You can provide user the required role using the RBAC tool.
Why the dashboard is taking too much time to load ?
The latency for the dashboard is dependent on the selected time interval. If you see longer load times and failure in loading dashboard please reach out to the Moveworks support team.
Updated 17 days ago