Form Insights
Overview
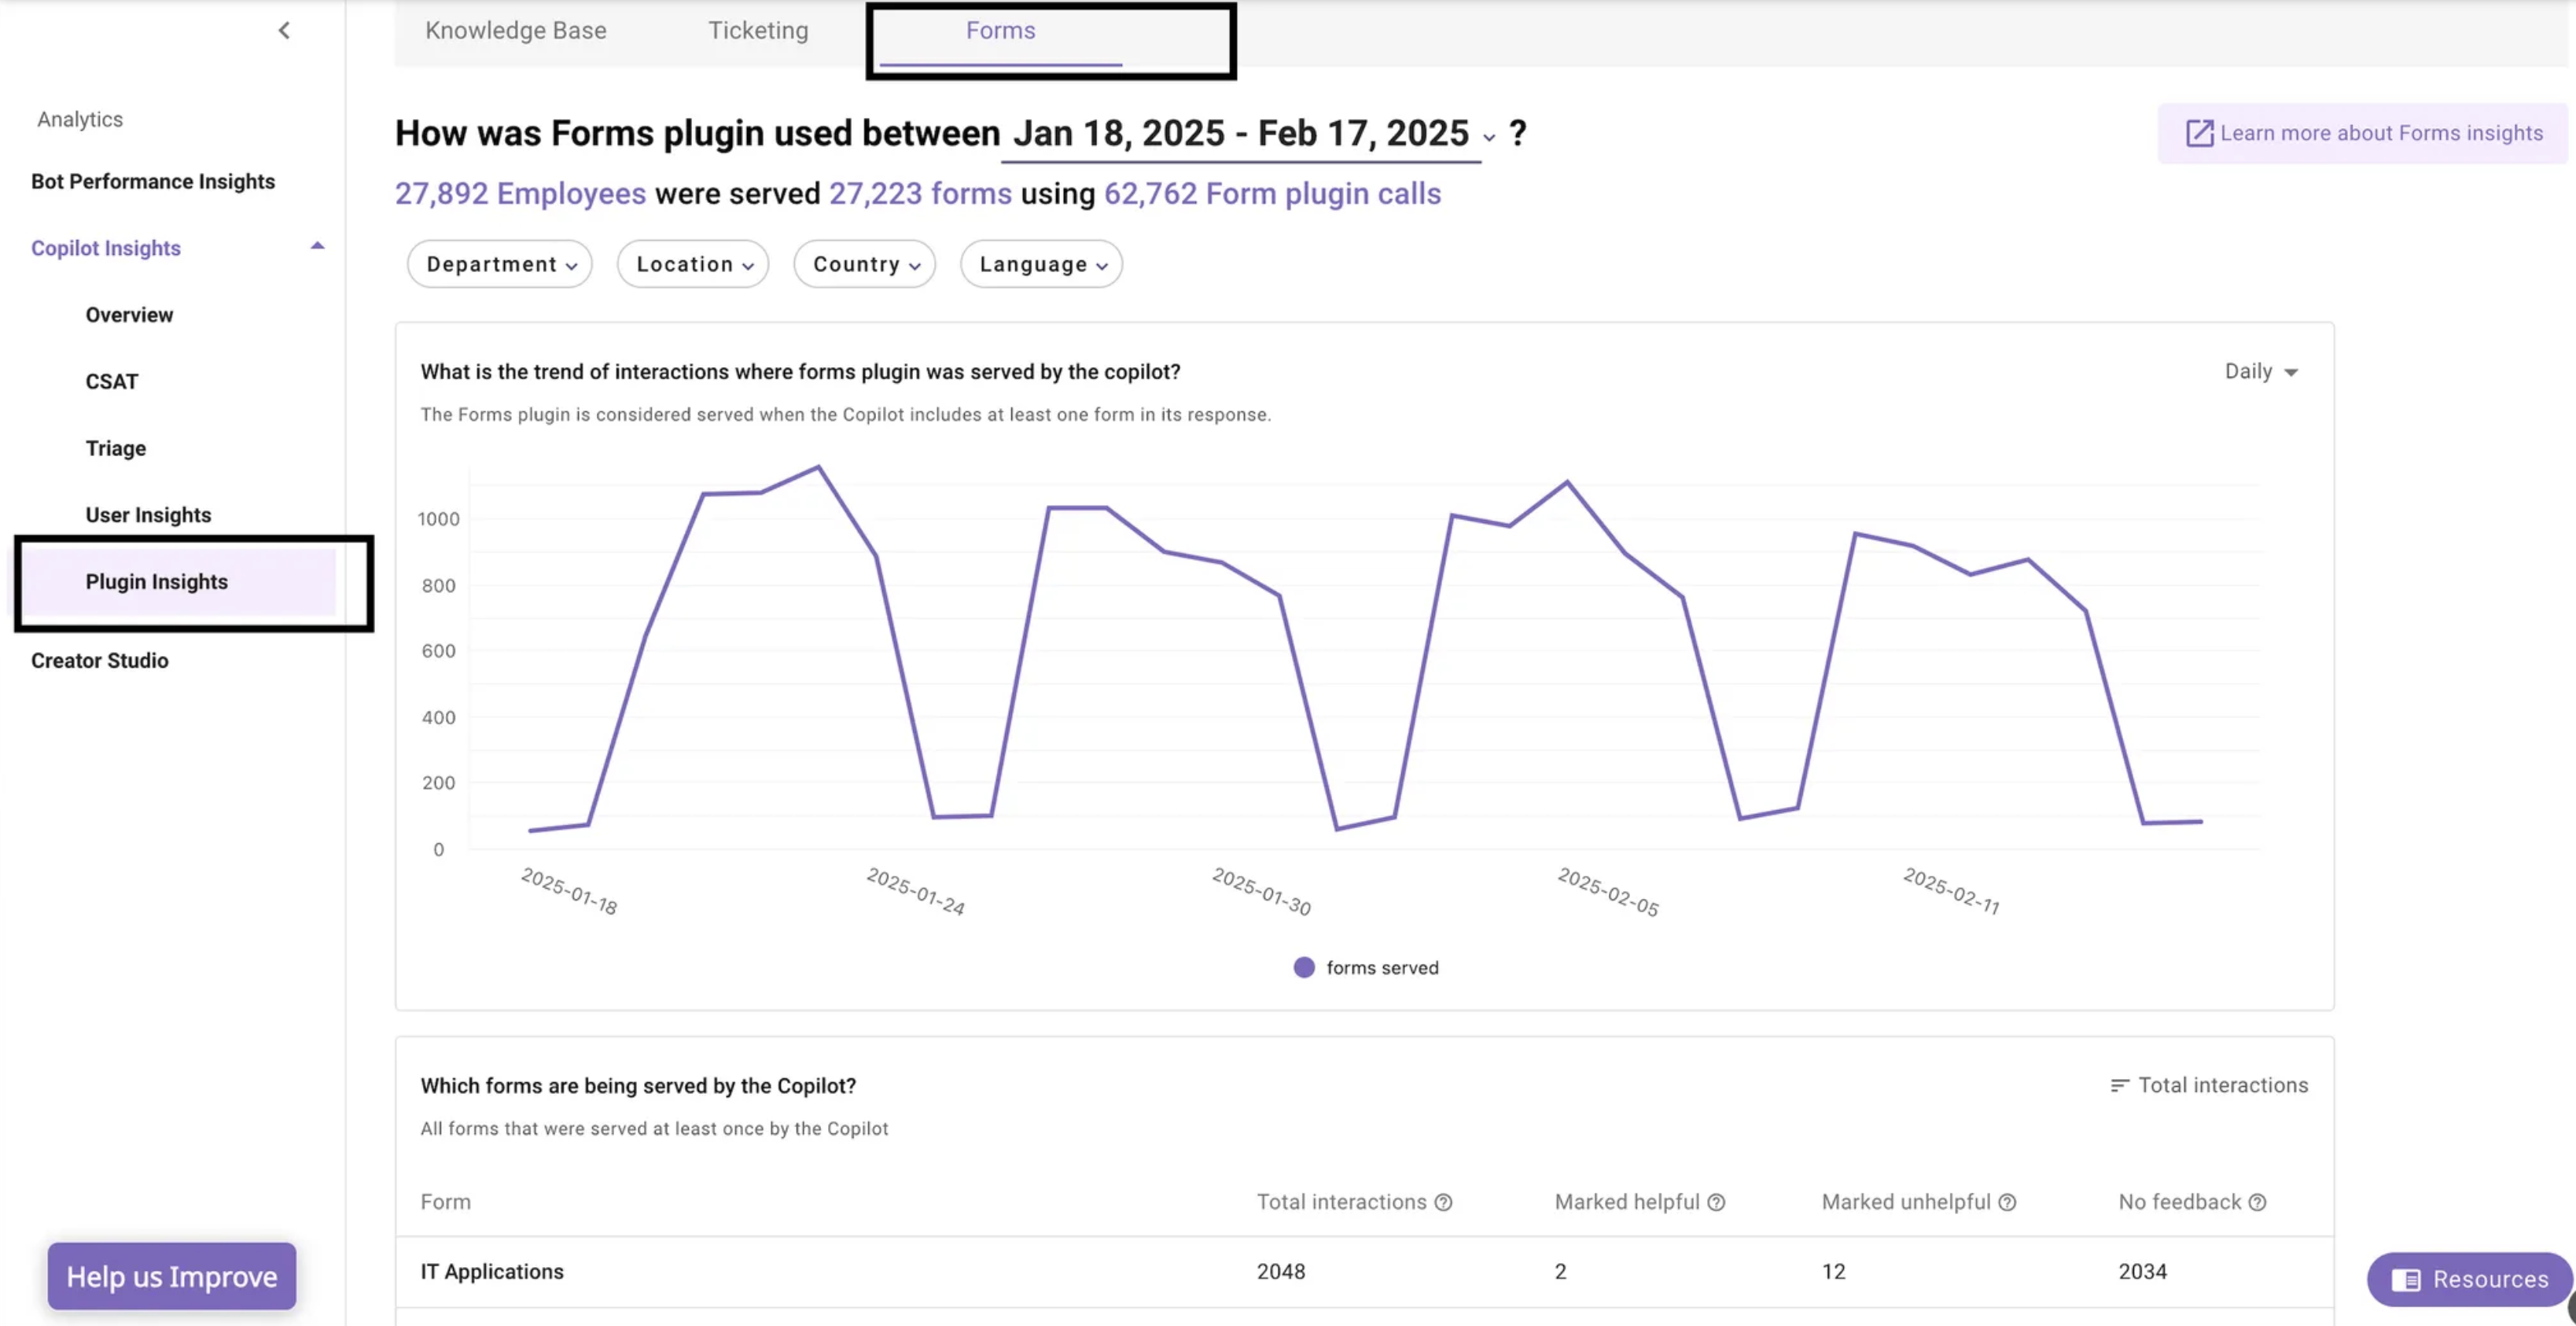
The Form insights report is available to all customers with access to AI Assistant Insights. You can access this dashboard by accessing the plugin insights present in the analytics application on the navigation sidebar. It gives you a quick view of how the form plugin has been performing corresponding to the employee queries.
Users with a “Bot analytics admin” or “Bot analytics viewer” role for the analytics application can access this report. Please add the users using the Roles and Permissions tool if they cannot see this report under the AI Assistant insights tab.
Key terms used in the dashboard
| Key terms | Definition |
|---|---|
| Interactions | All user utterances sent to the AI Assistant, button clicks in the AI Assistant's responses, link clicks in the AI Assistant's responses, file uploads for the Brief-Me plugin, and form submissions are defined as interactions. |
| Topic | Topics in the context of interactions and feedback table refer to the main subjects of communication between users and the AI Assistant. These topics emerge from free-form text interactions and utterances related to UI Form submissions where users seek specific information or assistance |
Filters and widget types
The Forms insights report allows you to filter AI Assistant adoption data for a selected time period, department, location, country and based on user preferred language.
Select date interval for which you want to review the served content details
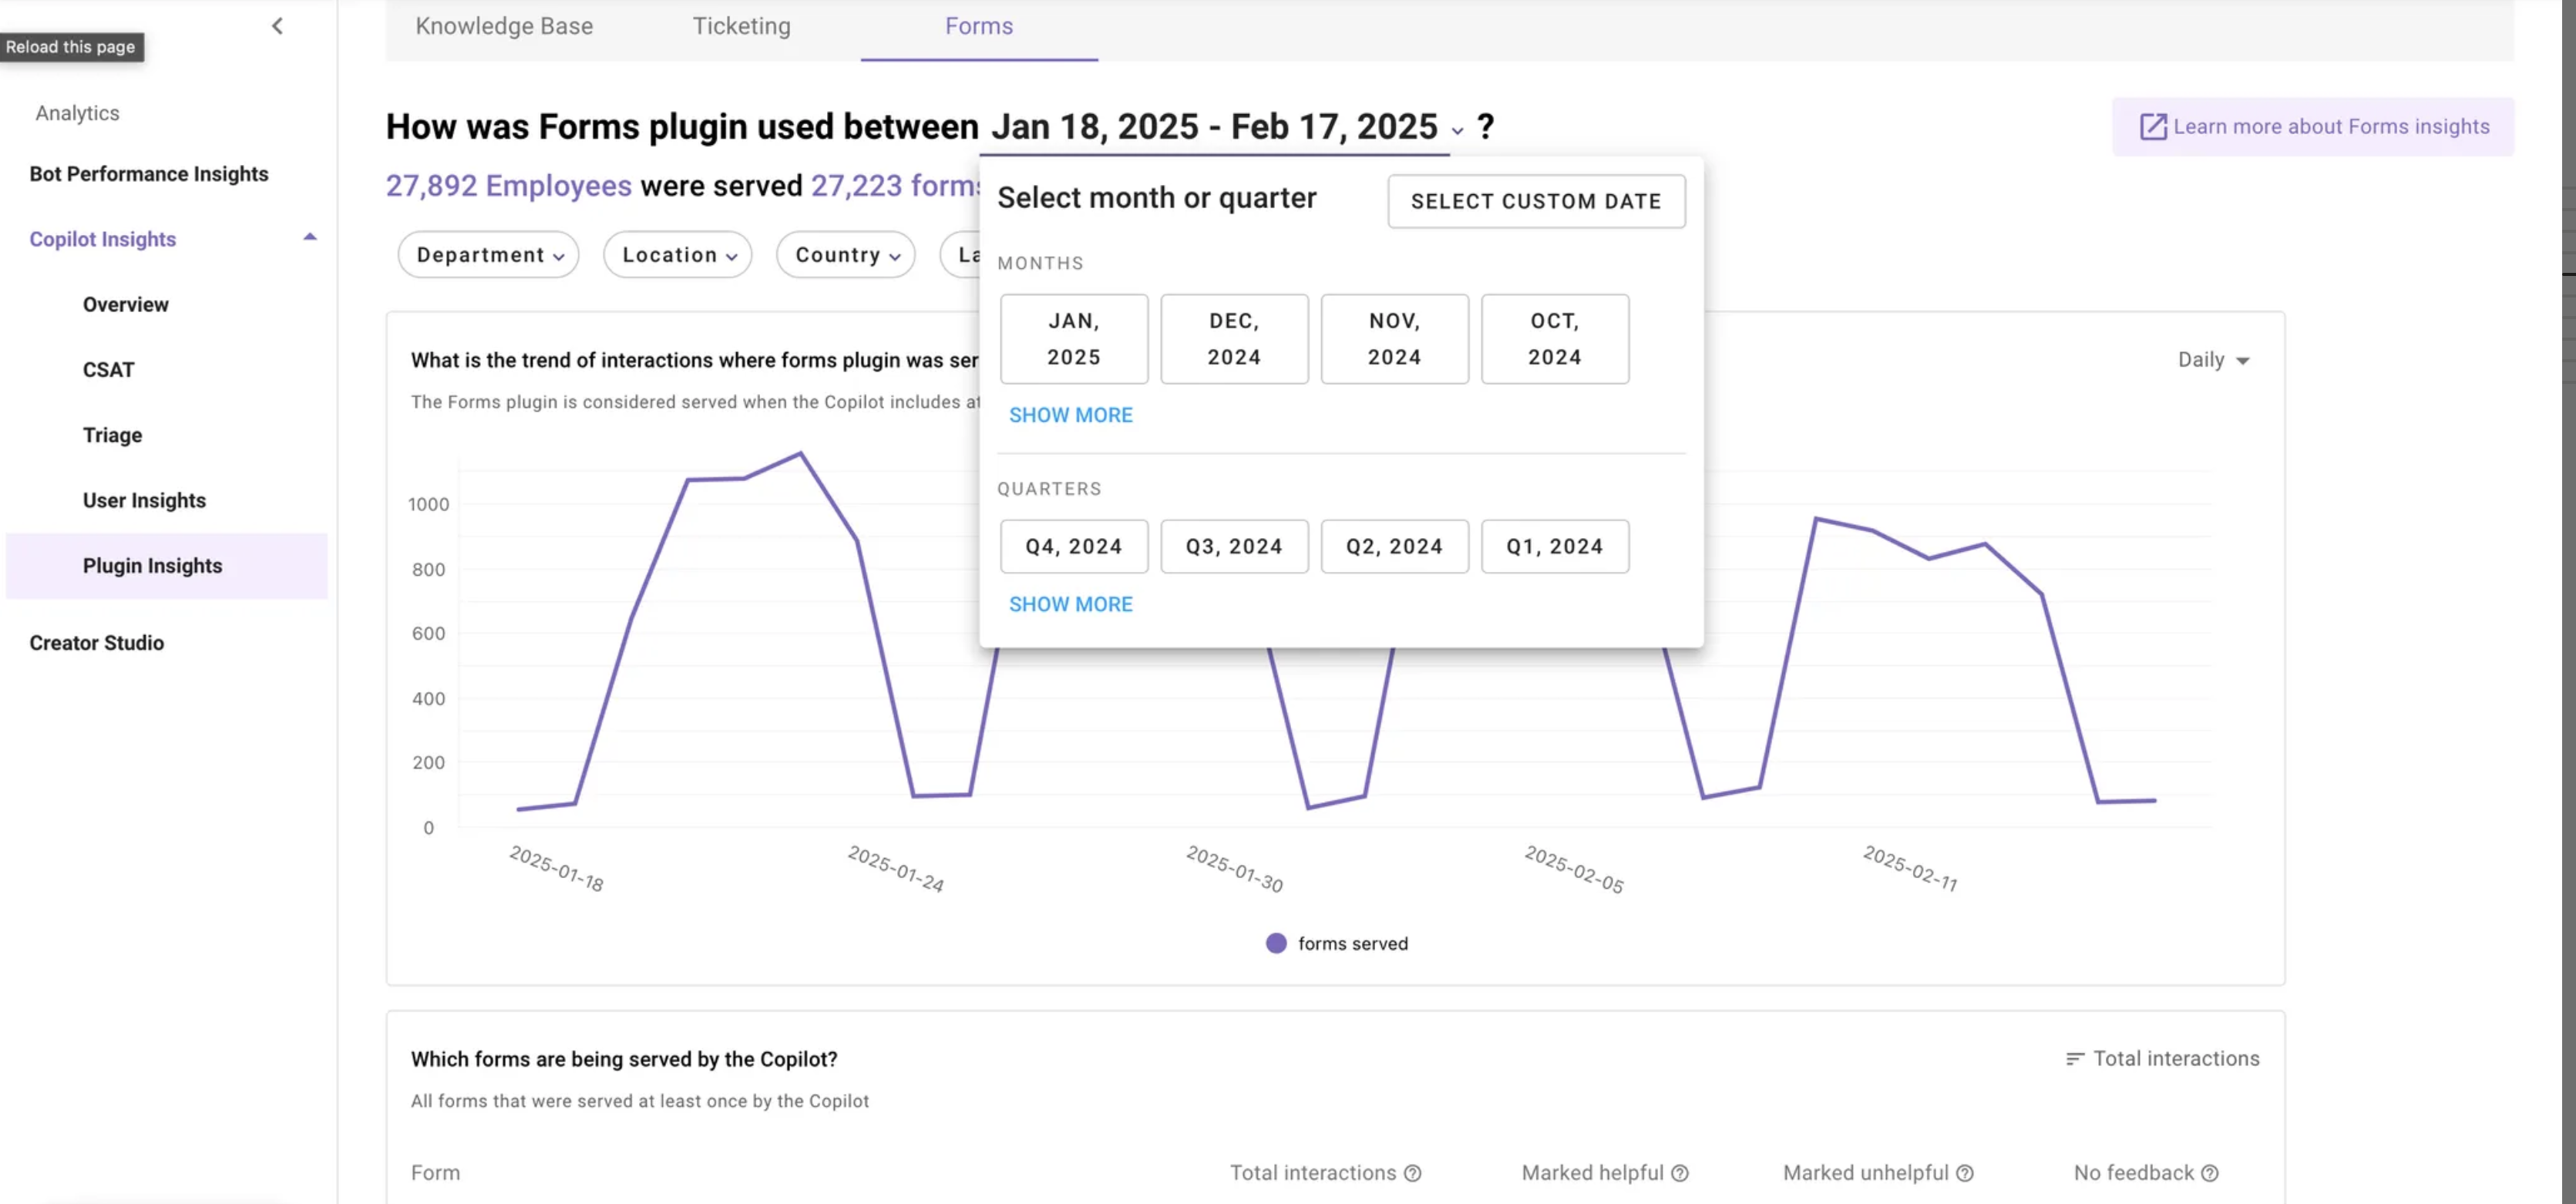
By default the dashboard show form plugin performance for previous 30 days. This can be changed using the date interval selection. You can select previous months (or) quarters using the selection available in the dropdown.
The dashboard also allows custom date interval selection. You can access that using the “select custom date” button.
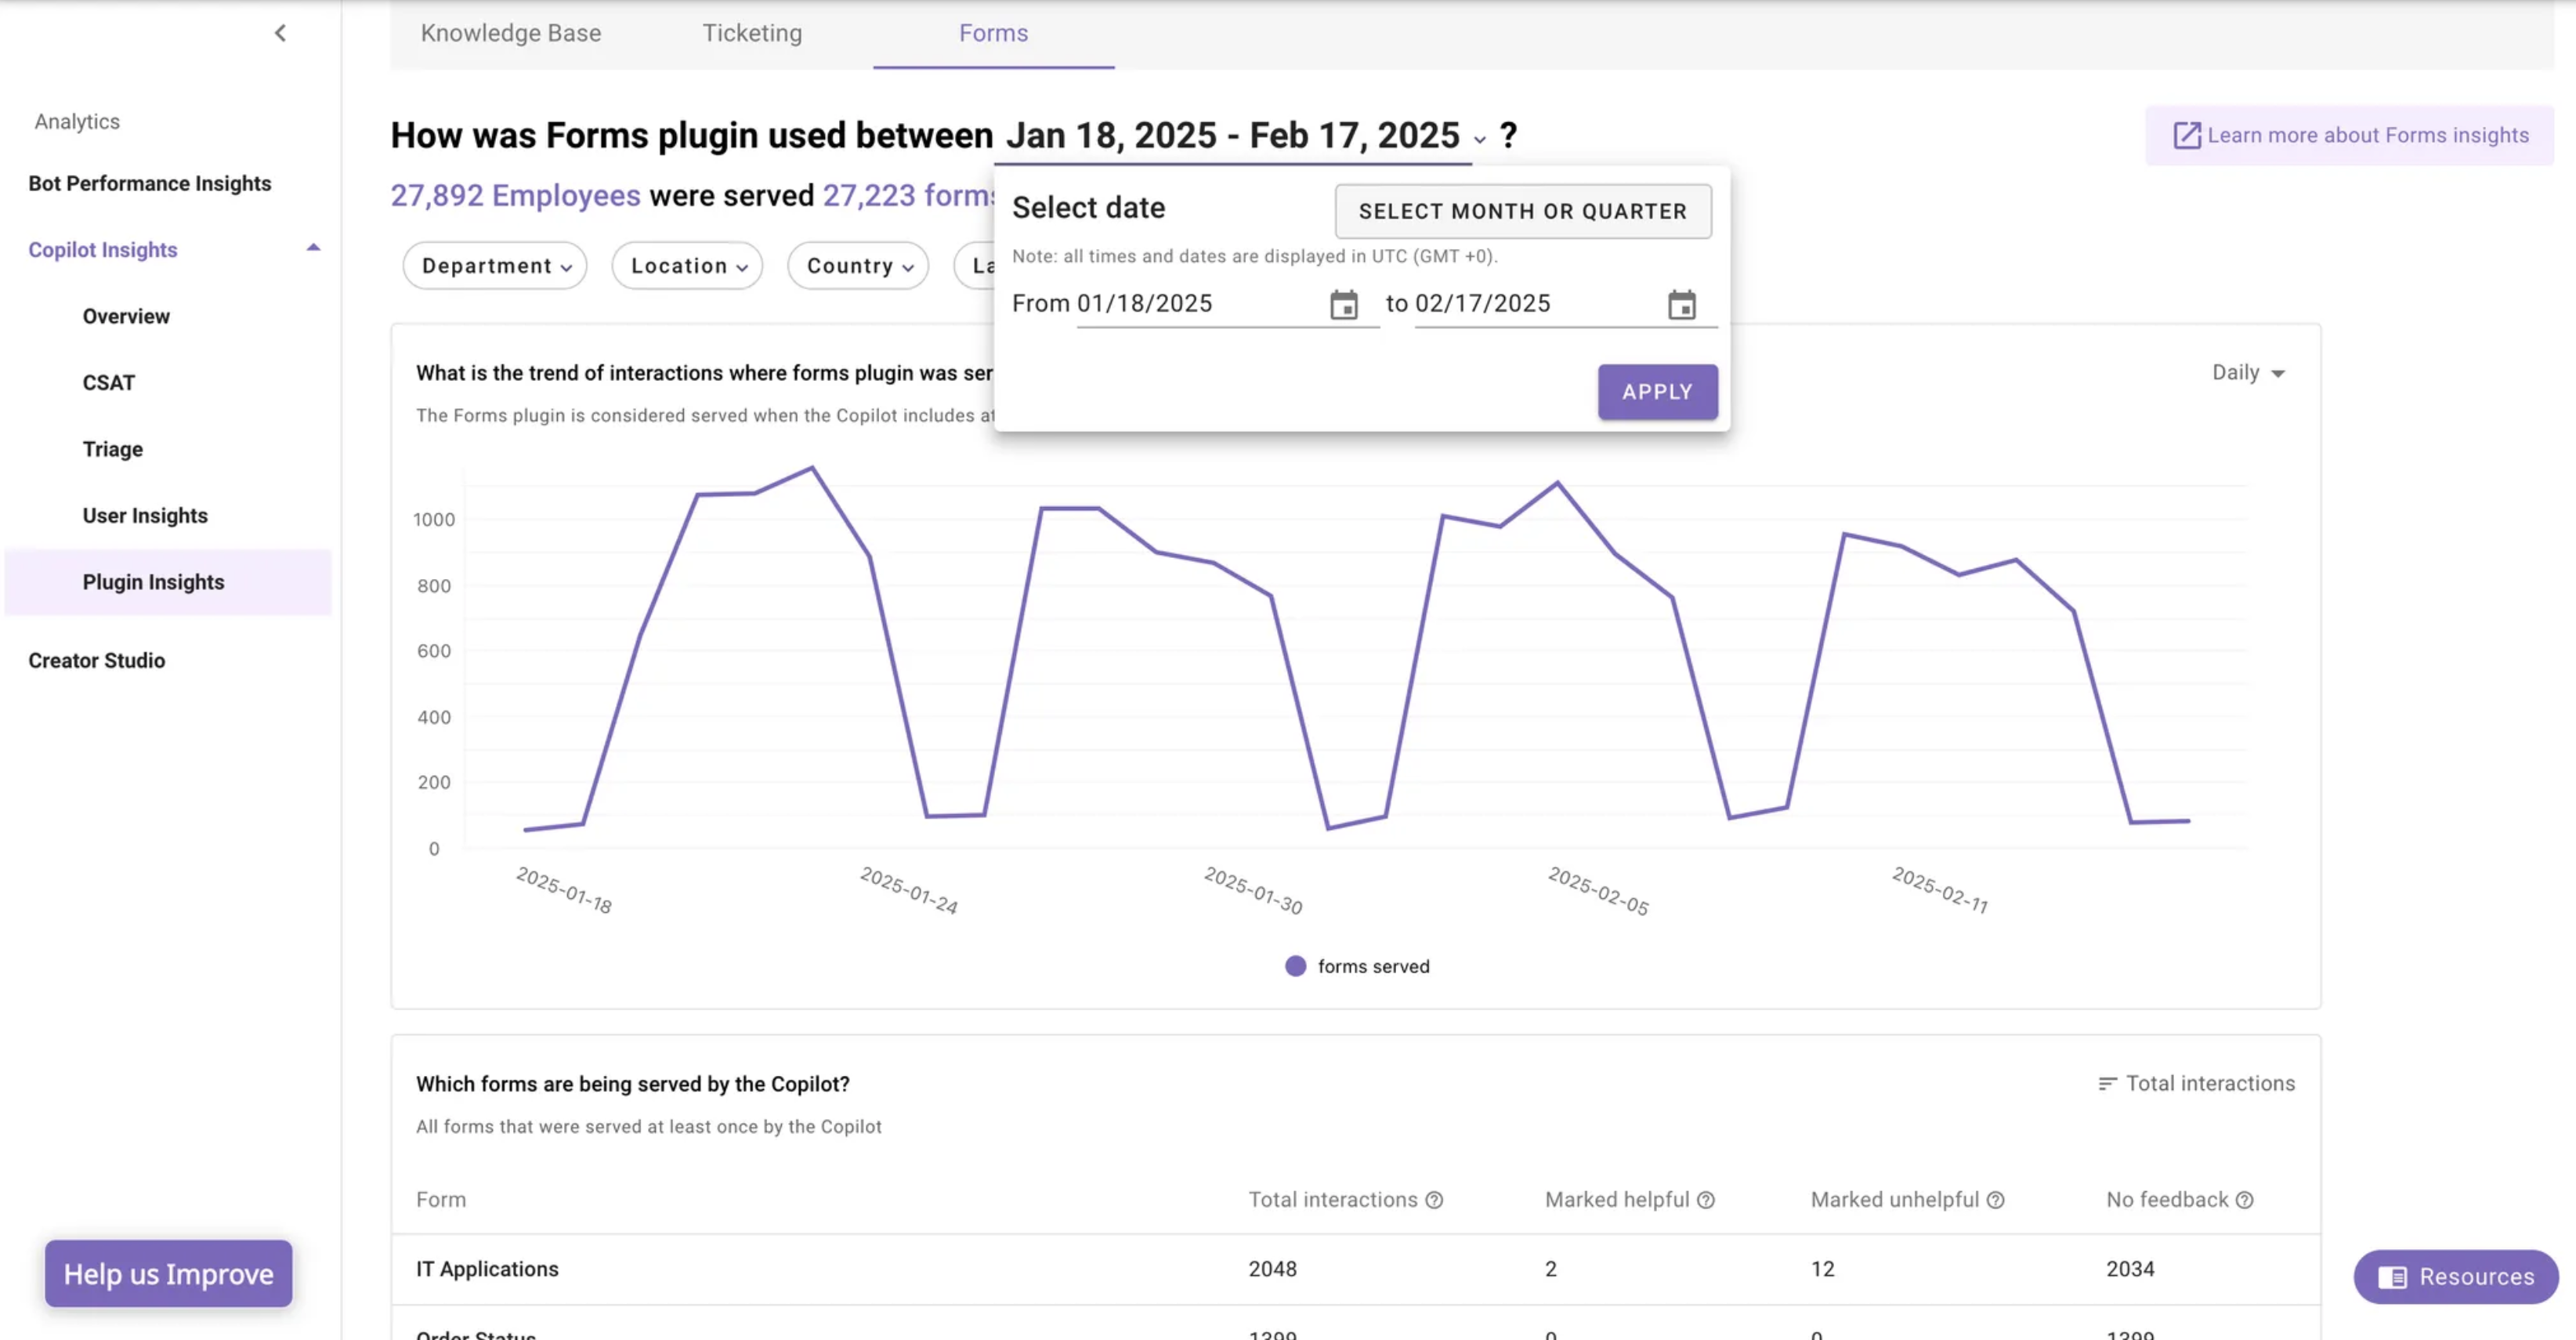
Please note, if you are choosing custom dates, the report data will be projected up to one day before the chosen end date.
Select department/ location/ country/ language for which you want review the served content details
Form insights report provides 4 top level filters which can used to filter the data
The department/location/country value is ingested from your external system used in user identity. Please refer here to learn more on user identity ingestion.
Widget types used in this dashboard
- Trend chart
Line chart or Bar chart that presents the values of one or more metrics over a period of time, with selectable time intervals (day, week, month). For example: trend of active user over a selected time interval.
The day, week, month breakdown is only visible for a selected time interval
| View type | Minimum time interval | Maximum time interval |
|---|---|---|
| Daily | 1 Day | 30 Days |
| Weekly | 2 Weeks | 26 Weeks |
| Monthly | 1 Month | 24 Months |
- Table
A tabular list of one or more dimensions and their metrics. For example: Potential form gaps table, this table provides details on the detected topics where Form plugin was called by the AI Assistant and there were no results that were served to the end users.
- Bar chart
A graphical chart that presents the value of one metric for each value of a dimension on horizontal or vertical bar chart. For example: Served content volume, this chart shows the total number of content being served by AI Assistant based on a daily/weekly/monthly breakdown.
Deep dive into widgets
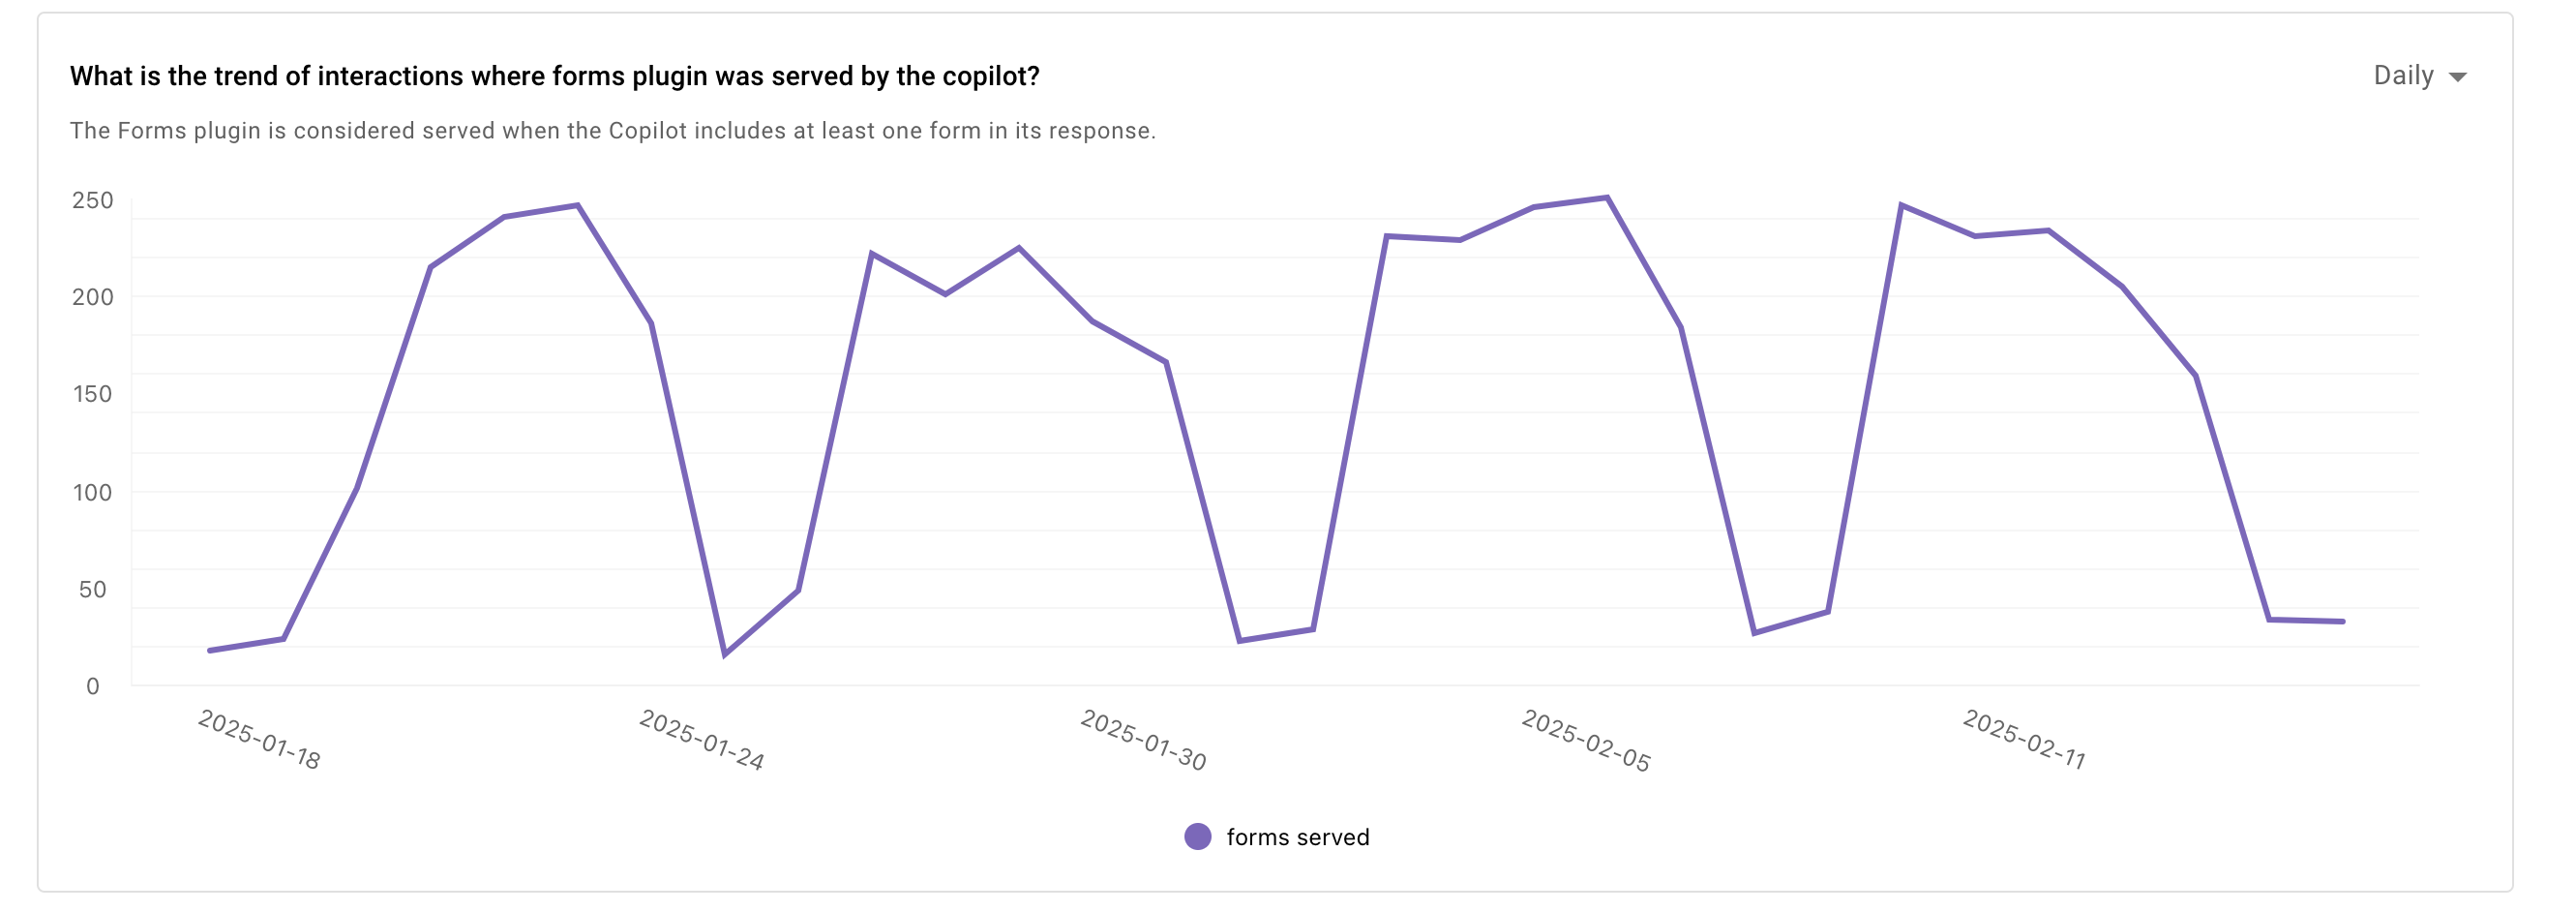
Trend of Forms base plugin
This widget provides the trend of interactions where a Form plugin was called by the AI Assistant and results where shown to the end users successfully. The trend chart provides a distribution by either day/week/month for the selected time period. This widget helps in understanding how the forms plugin is being utilized by the AI Assistant to help the end users.
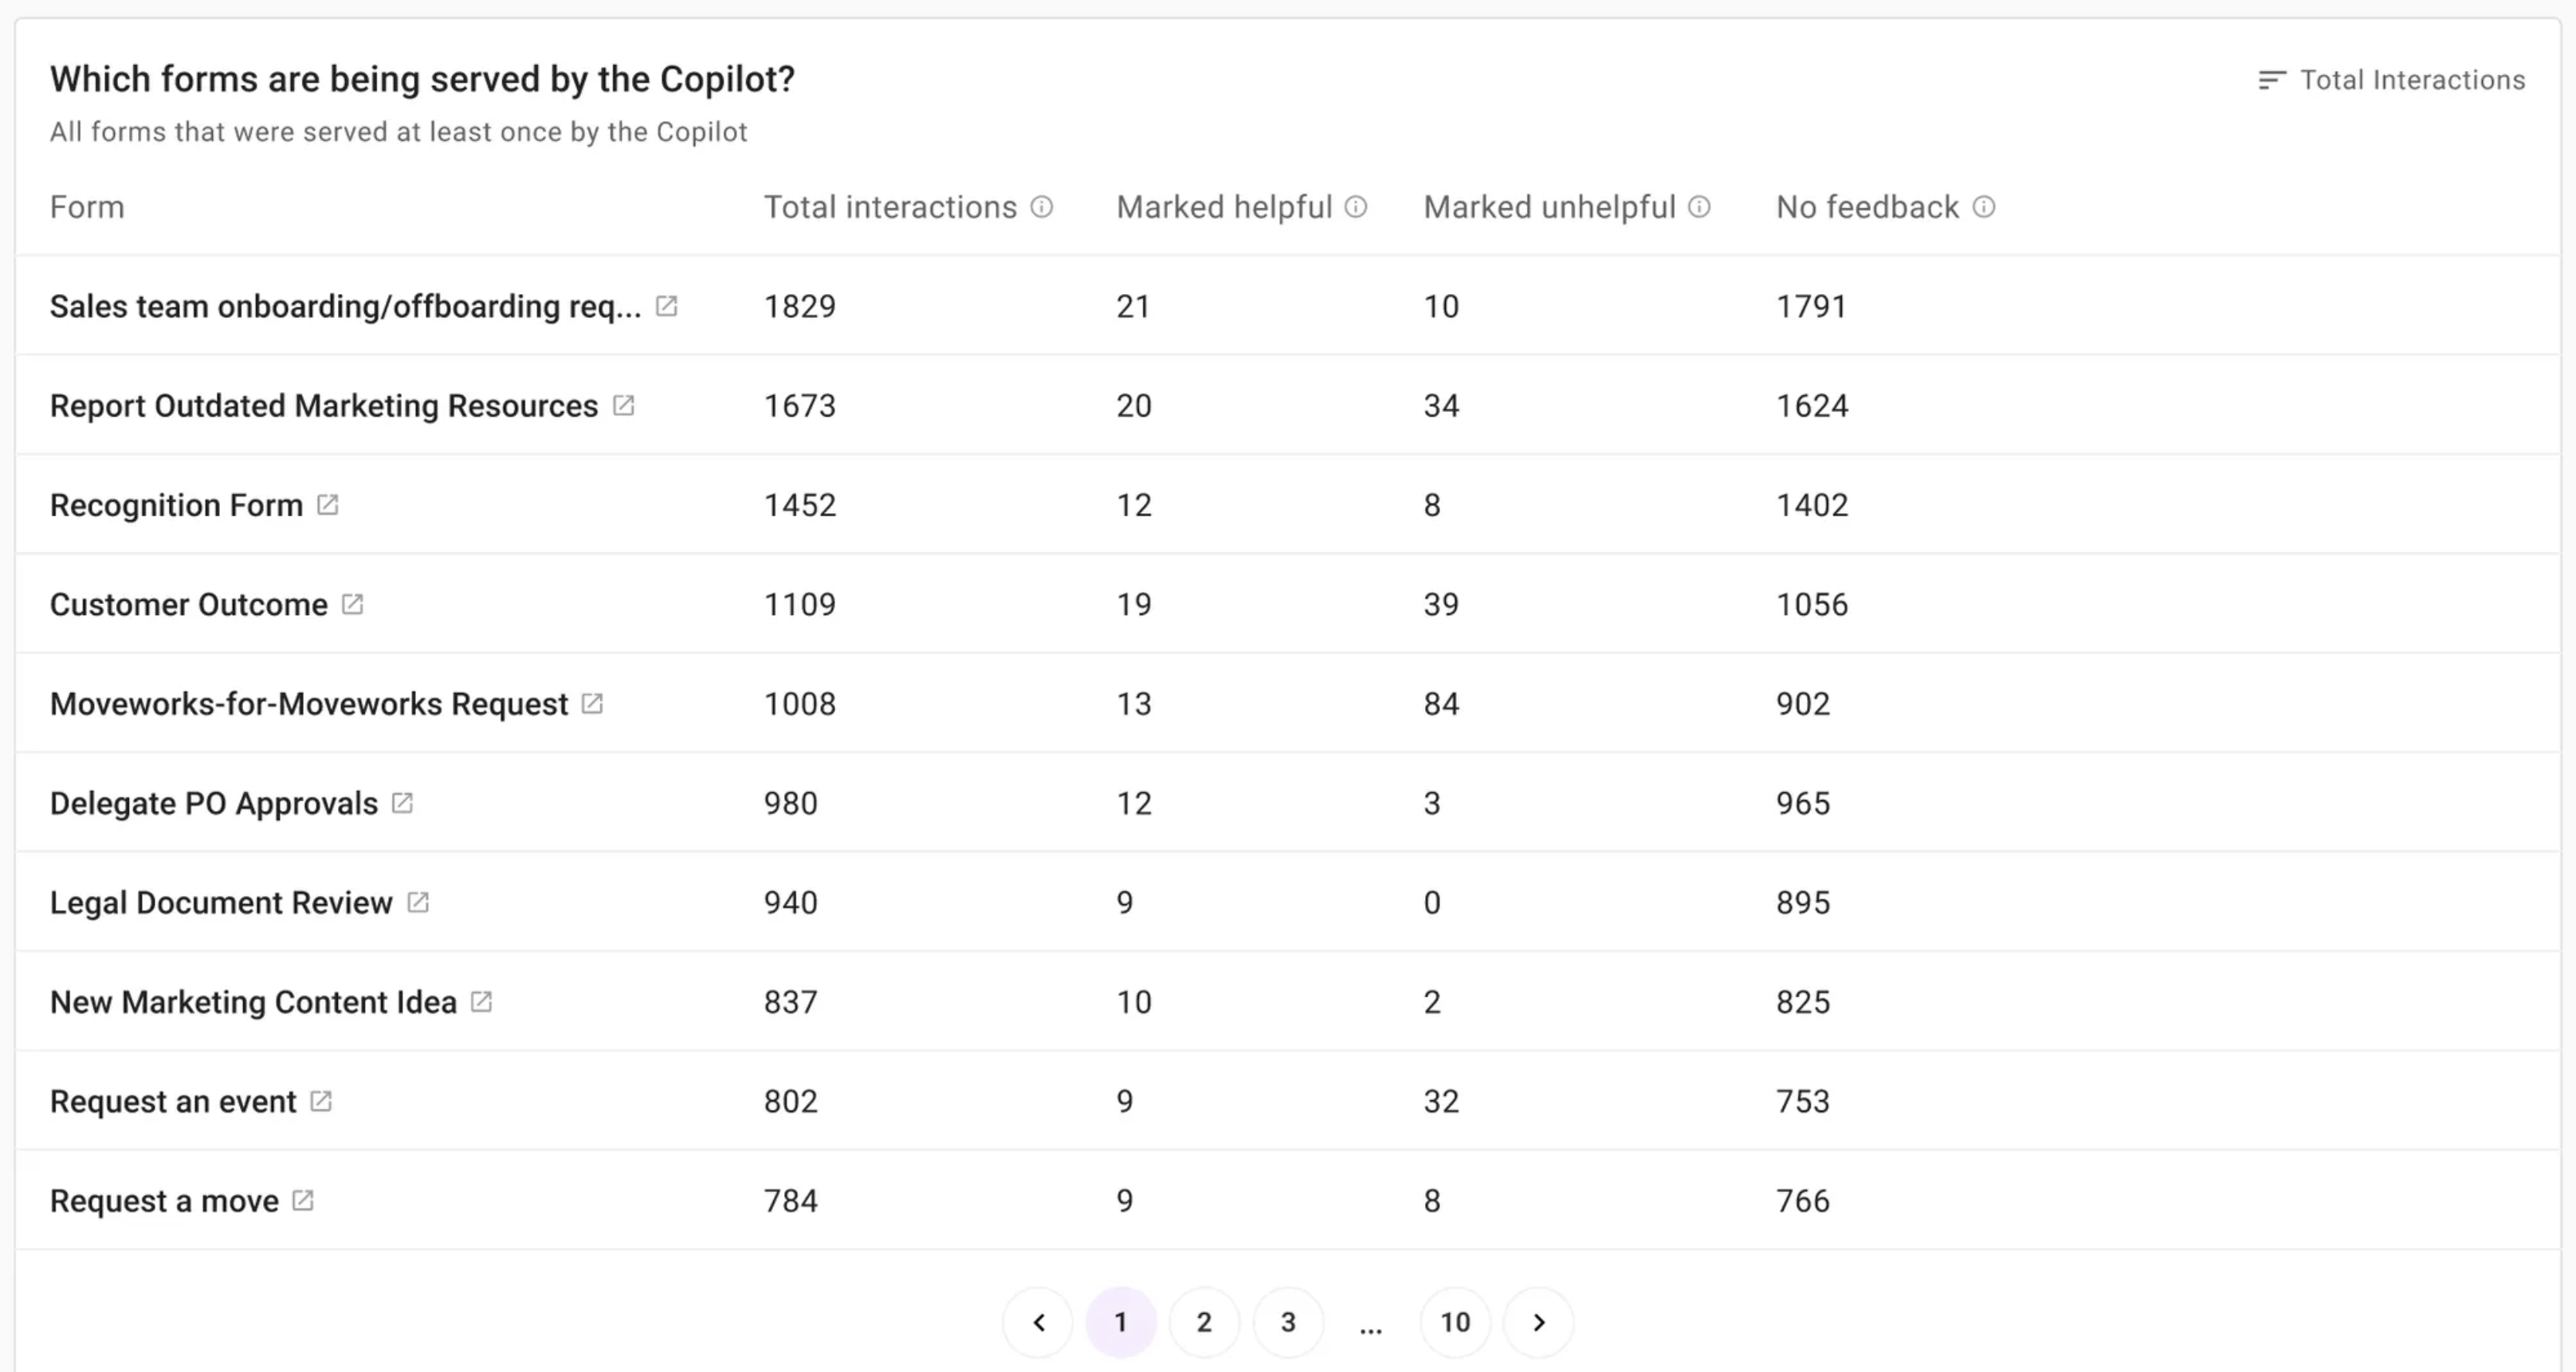
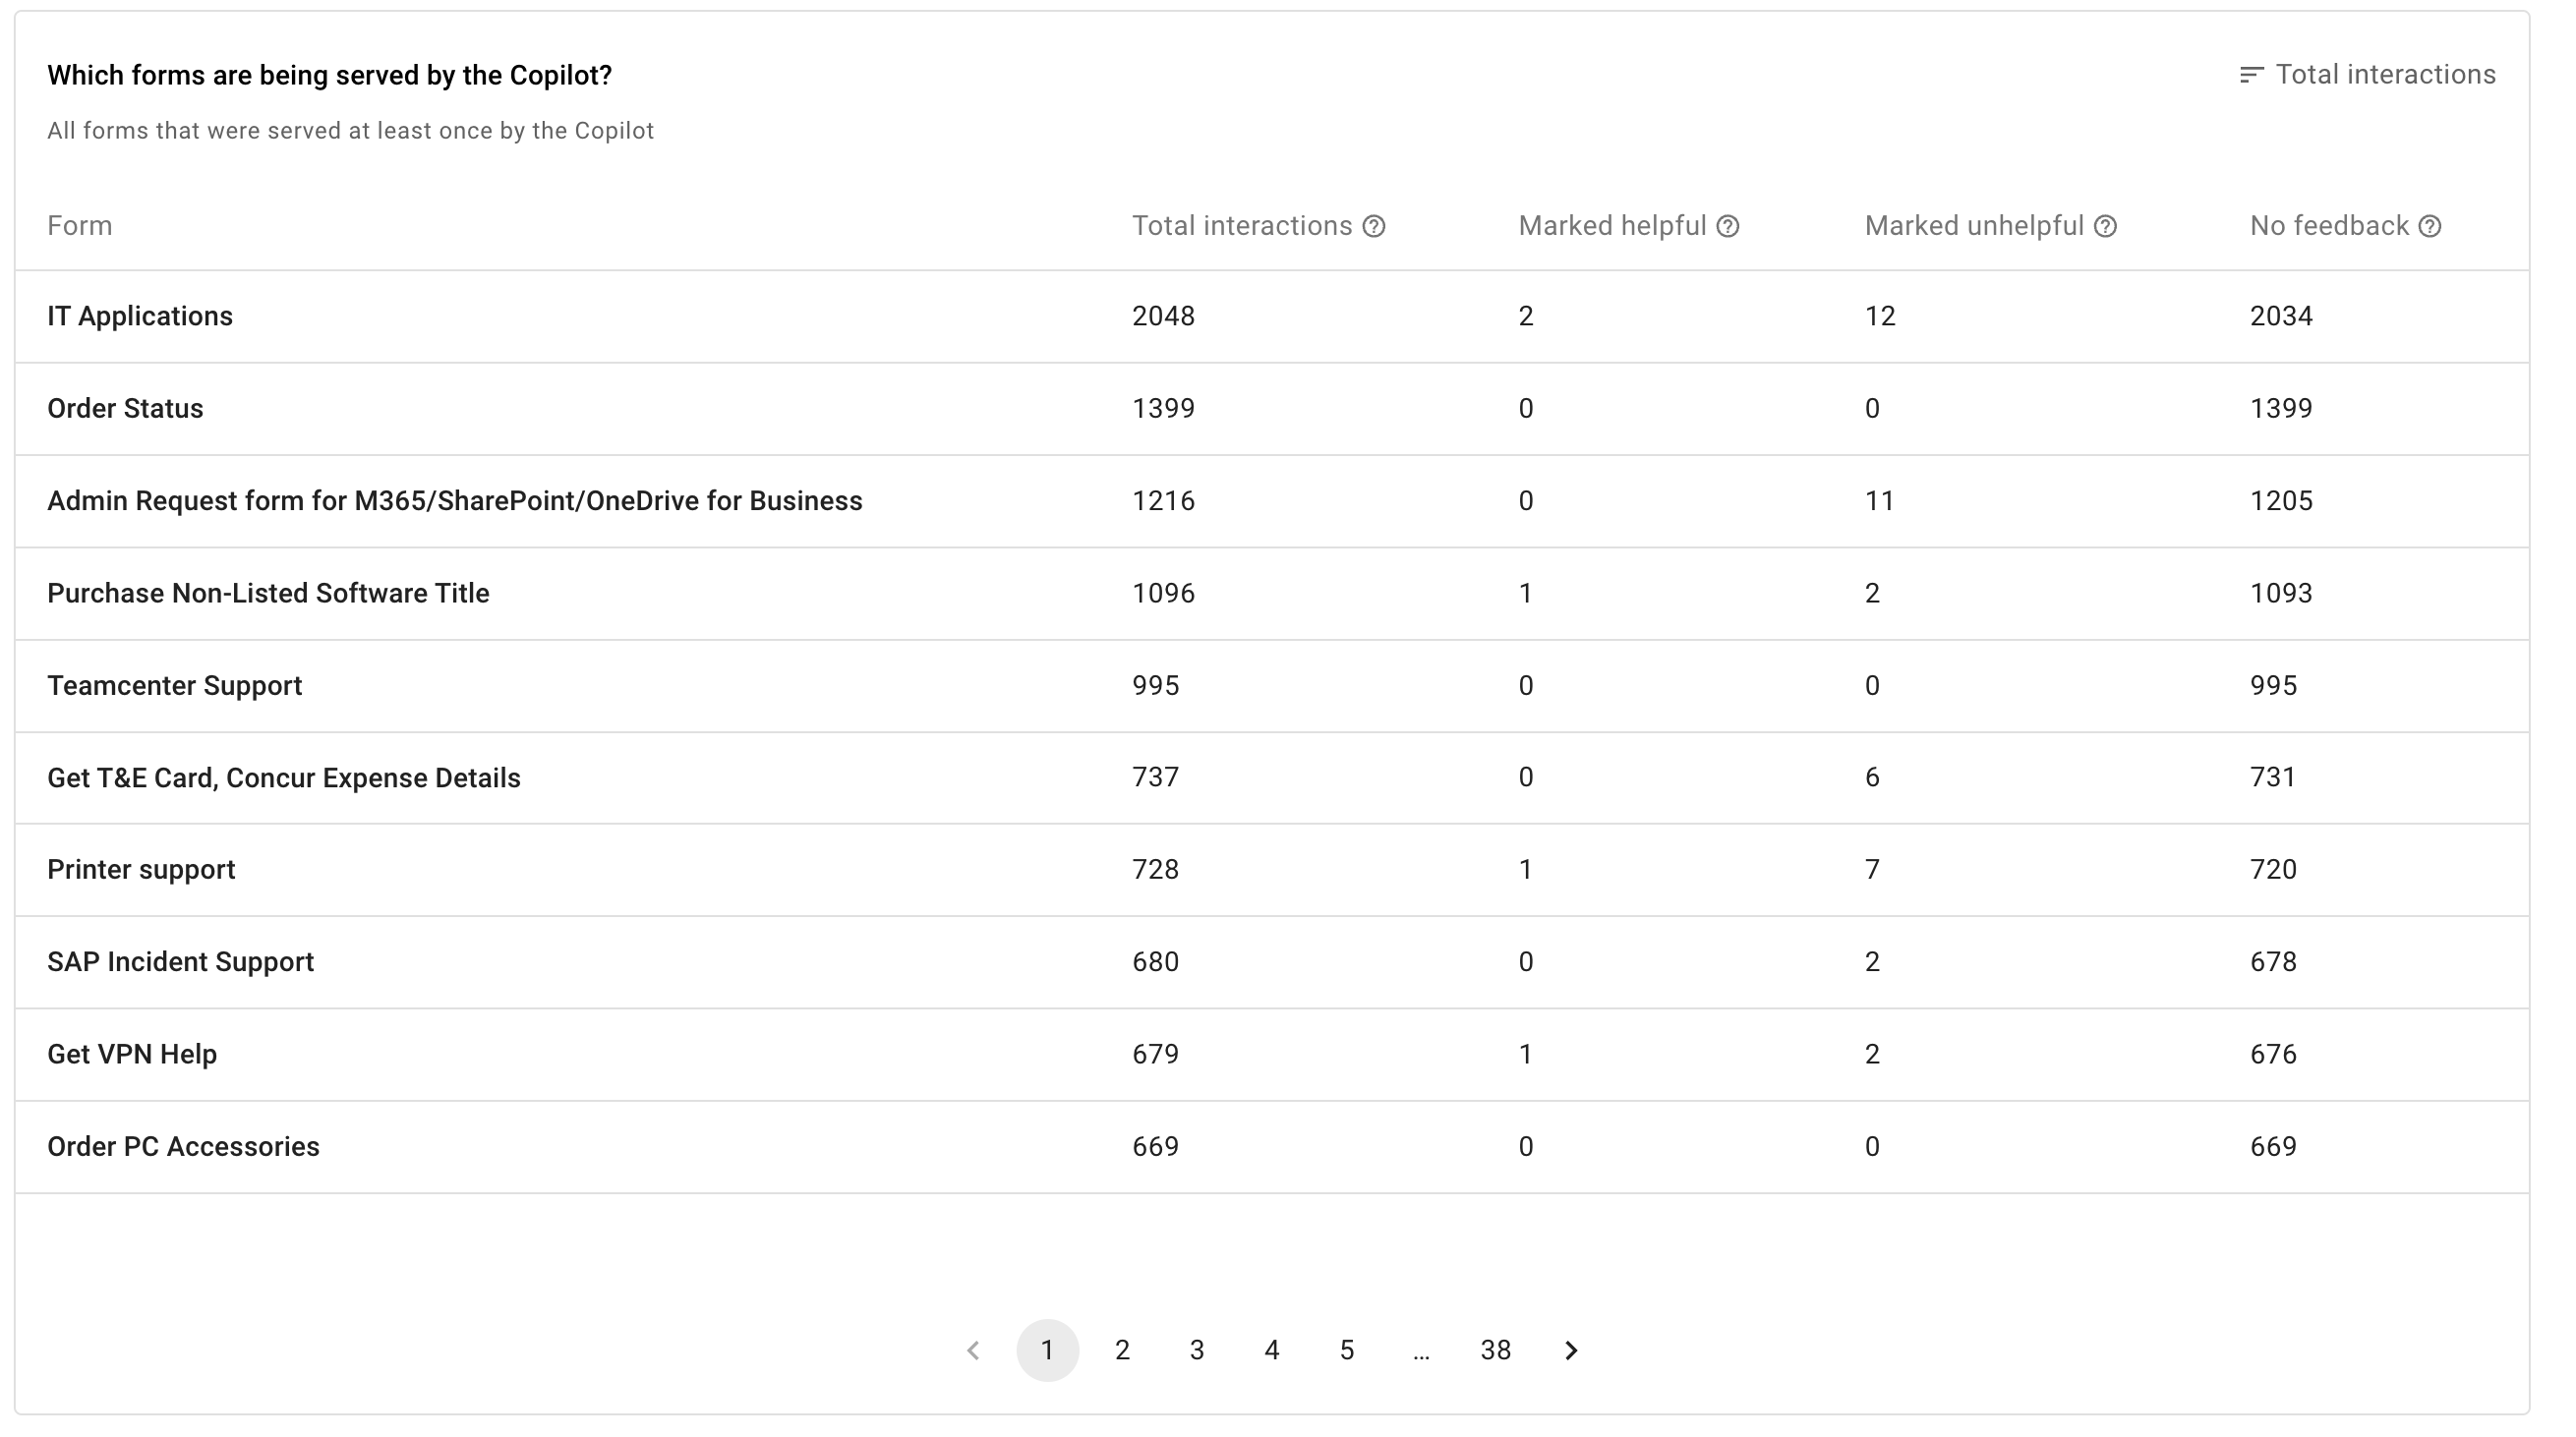
Forms cited by AI Assistant.
This widget shows the forms that are served by the AI Assistant as a part of the summarized responses. The table provides details on the following points
- Form name
- Total interactions where this form was served
- Number of times users have marked the AI Assistant response as helpful
- Number of times users have marked the AI Assistant response as unhelpful
- Number of times users did not provide any feedback on the AI Assistant response
This enables insights at a citation level and provide information on what form needs to be updated and is not helpful to the end users.
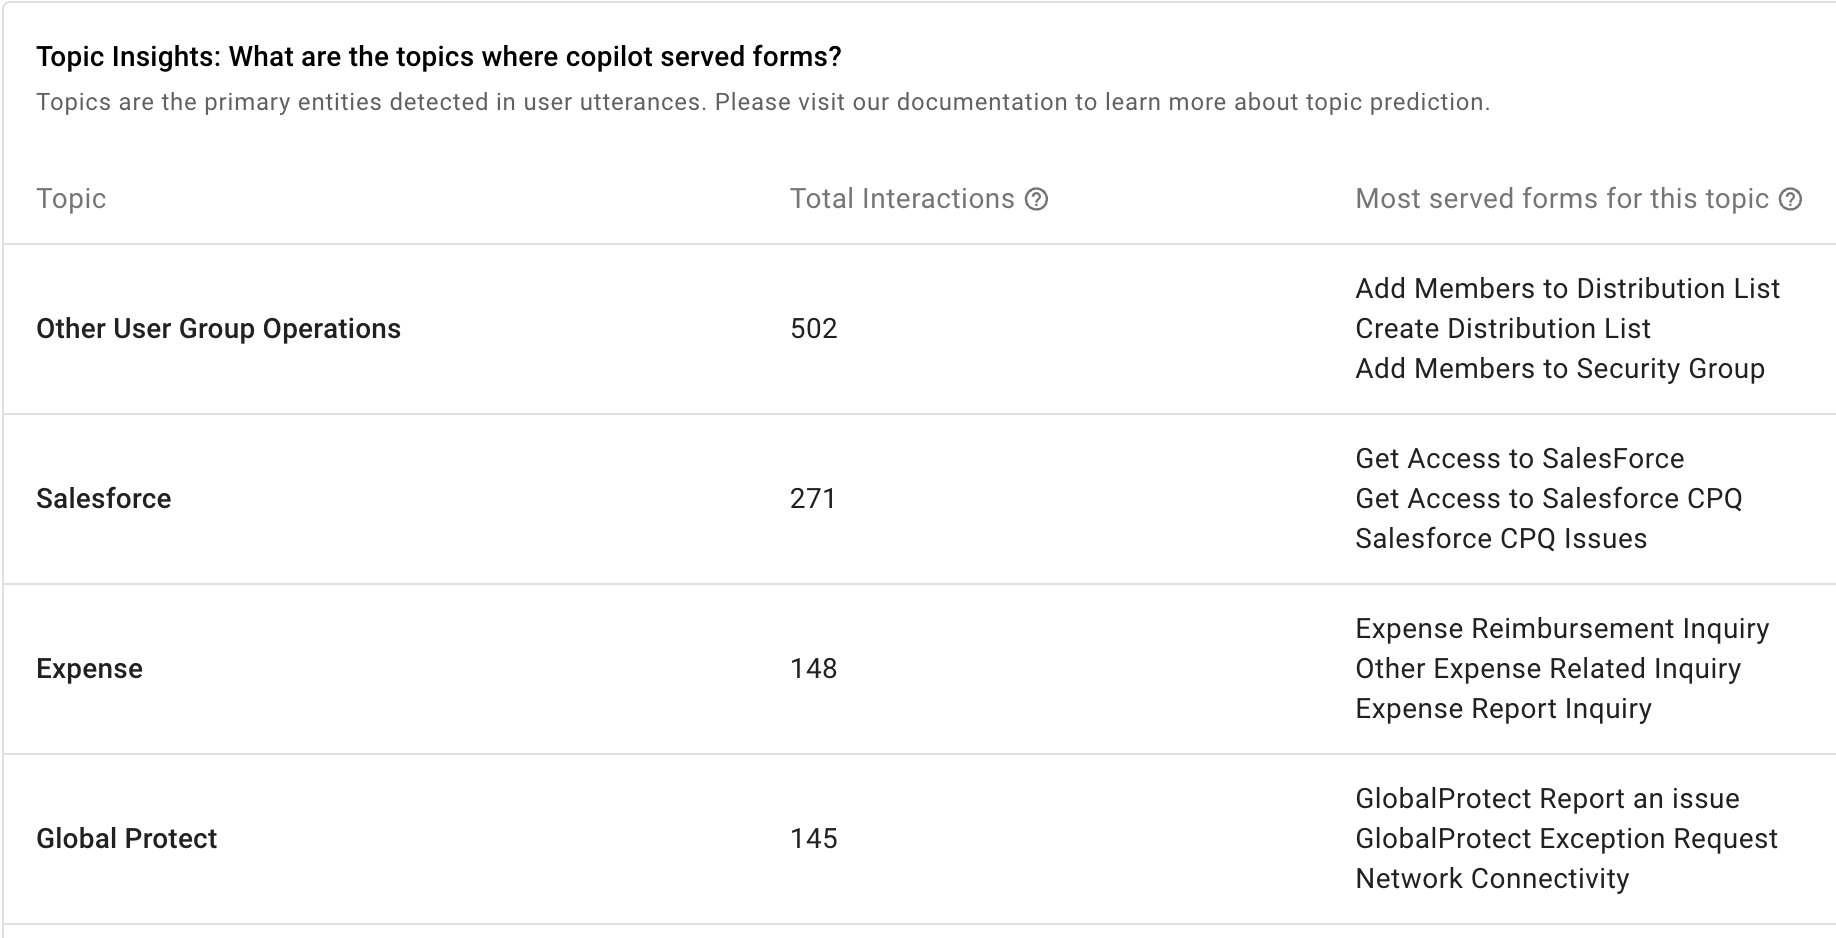
Topic insights
This widget shows topics detected by the AI Assistant when a form plugin was used to provide a response to the end user. The topics are detected by the Moveworks entity detection model by parsing the user utterances and generally refer to a software (or) any platform the user is facing issues on. This widget enables insights which are the most popular topics where users are served a form.
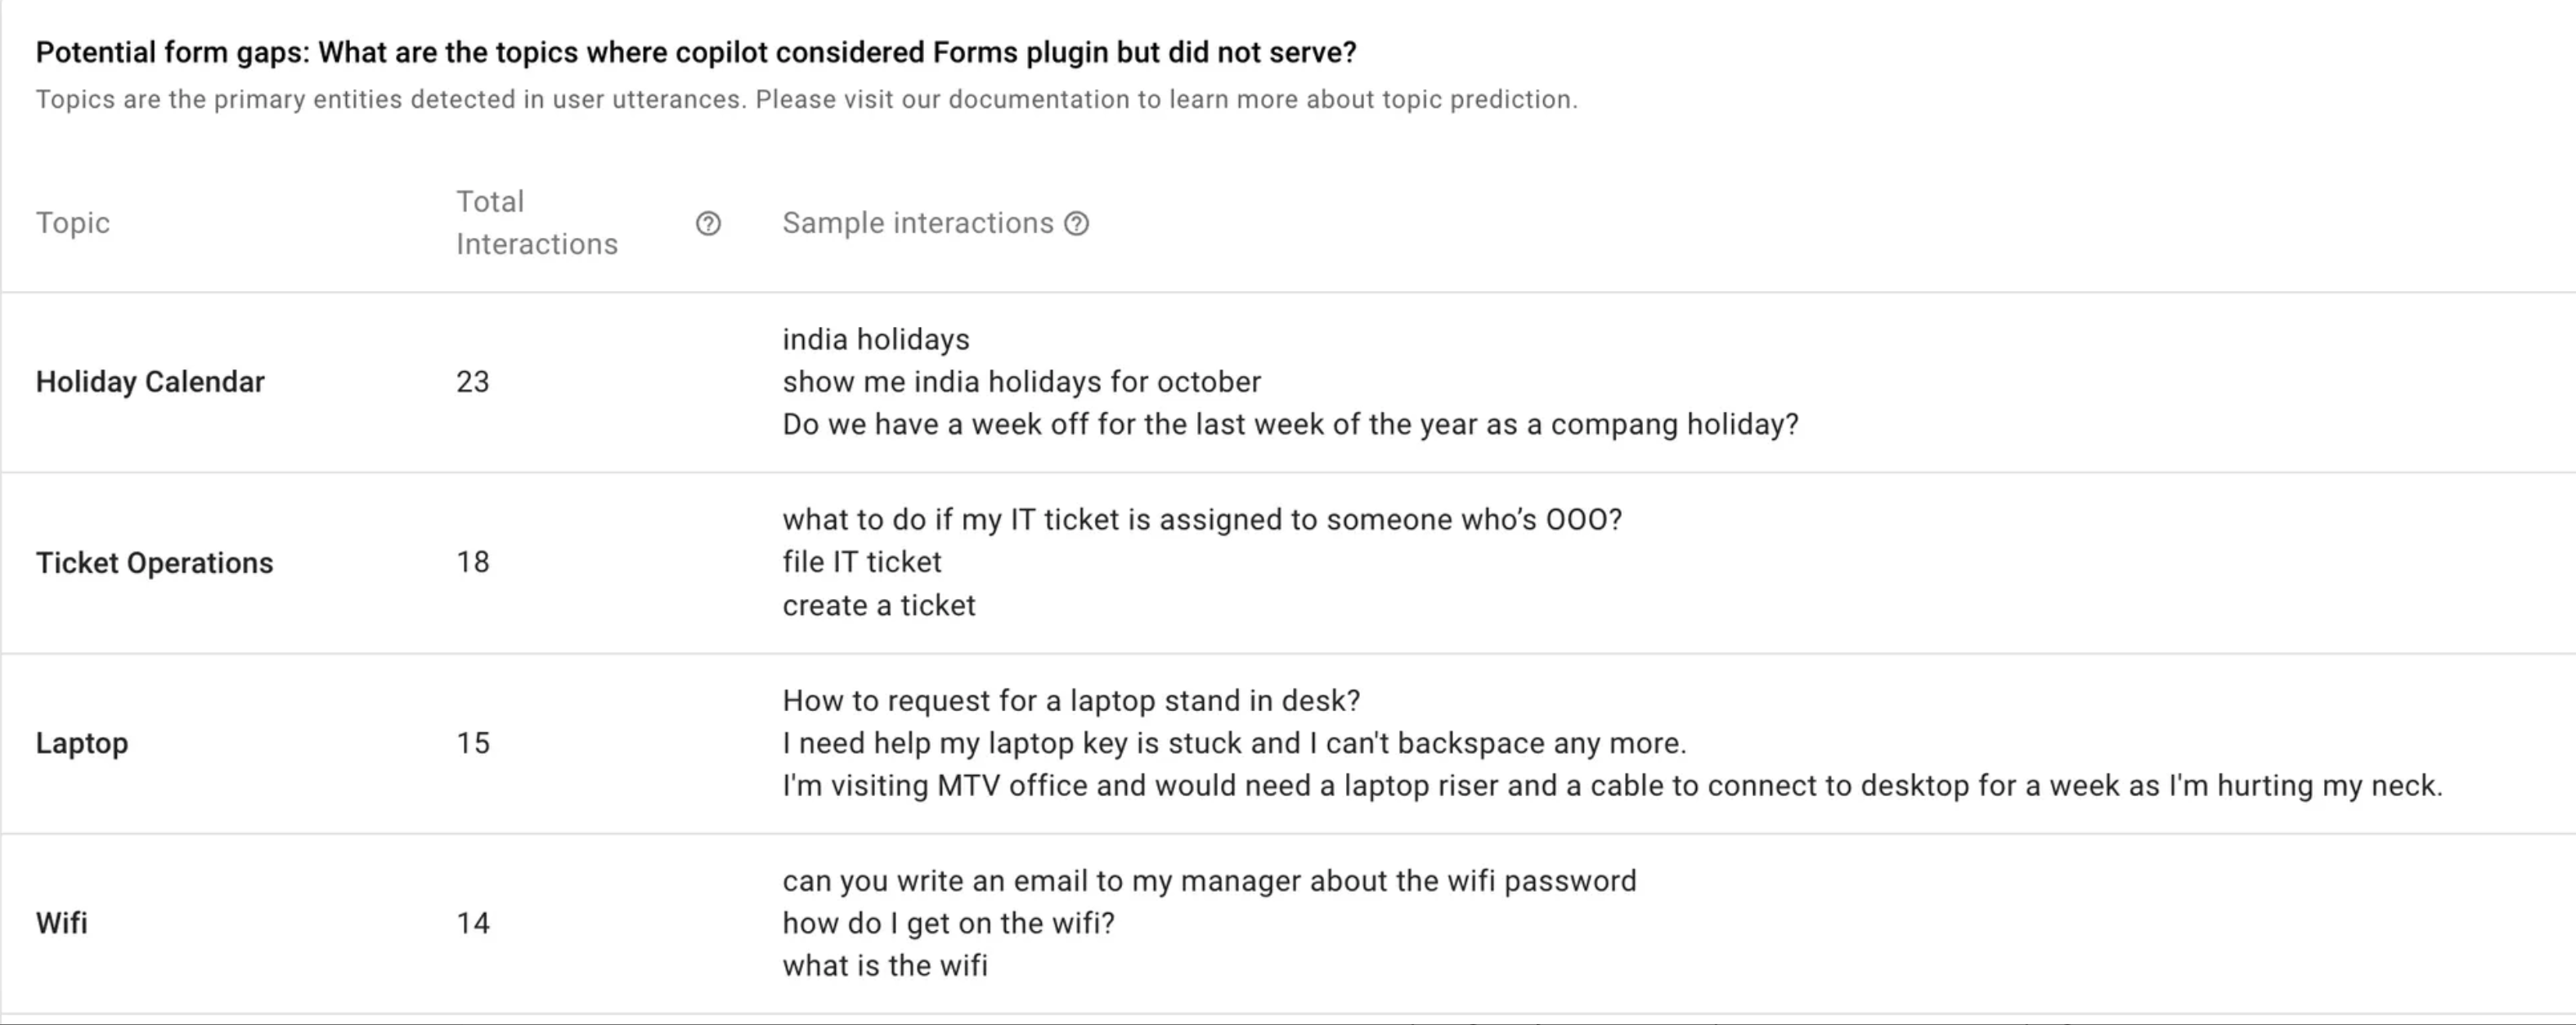
Potential form gaps
This widget highlights all the topics where the AI assistant considered serving the form to the user but ended up not serving because of lack of confidence.
Please noteThis widget is prescriptive in nature, this means that not all topics would be considered as a gap in forms.
For example: In the snip below, creating a form for Holiday calendar might not be very impactful but for laptop and hardware issues it might.
Common questions that are answered in this dashboard
How can I see the performance of the forms that I have ingested ?
-
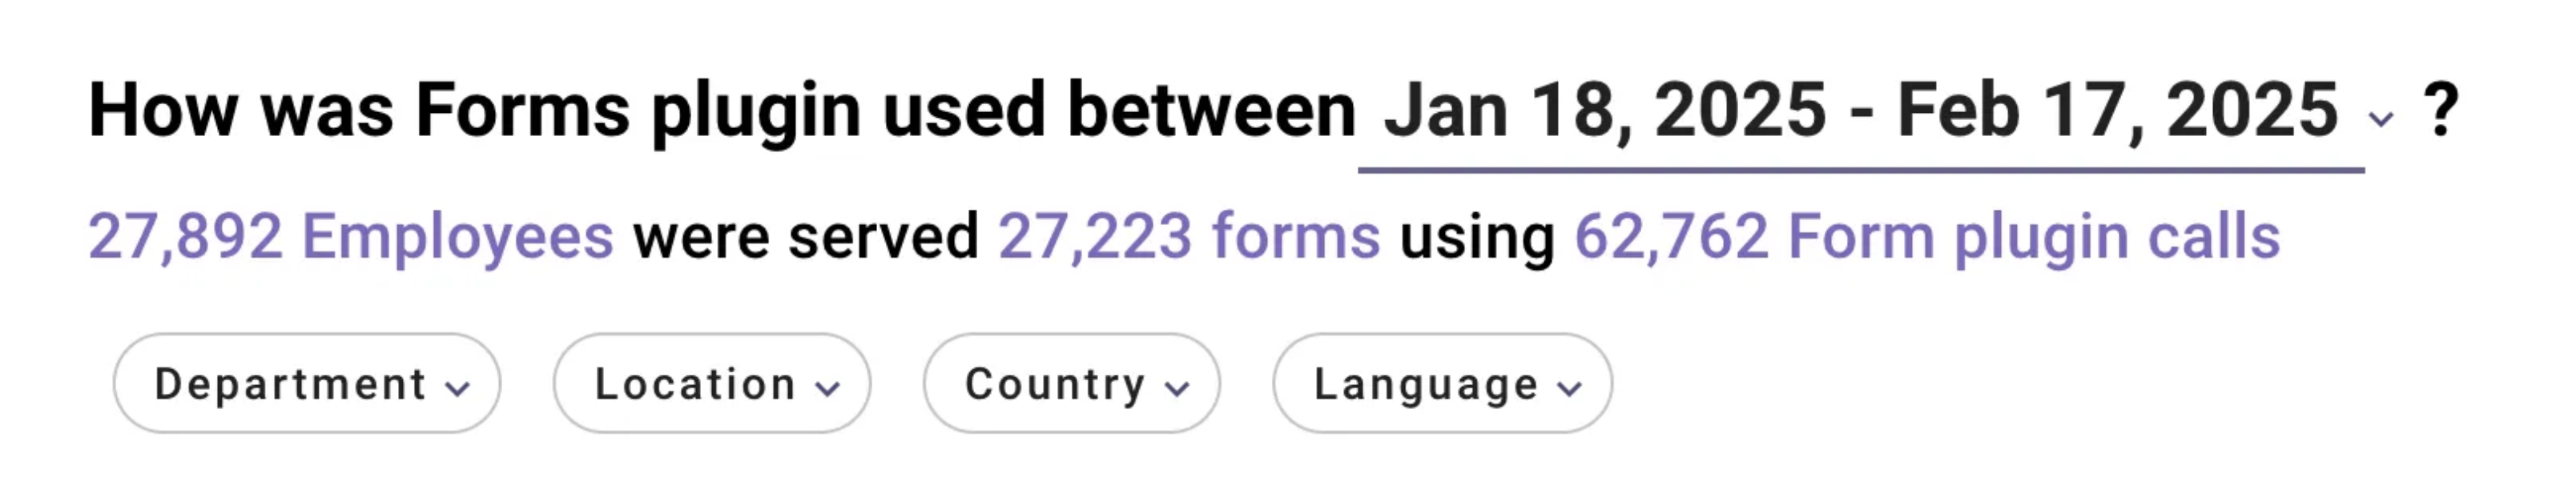
The first statement of the report gives you a sense of performance of the forms plugin
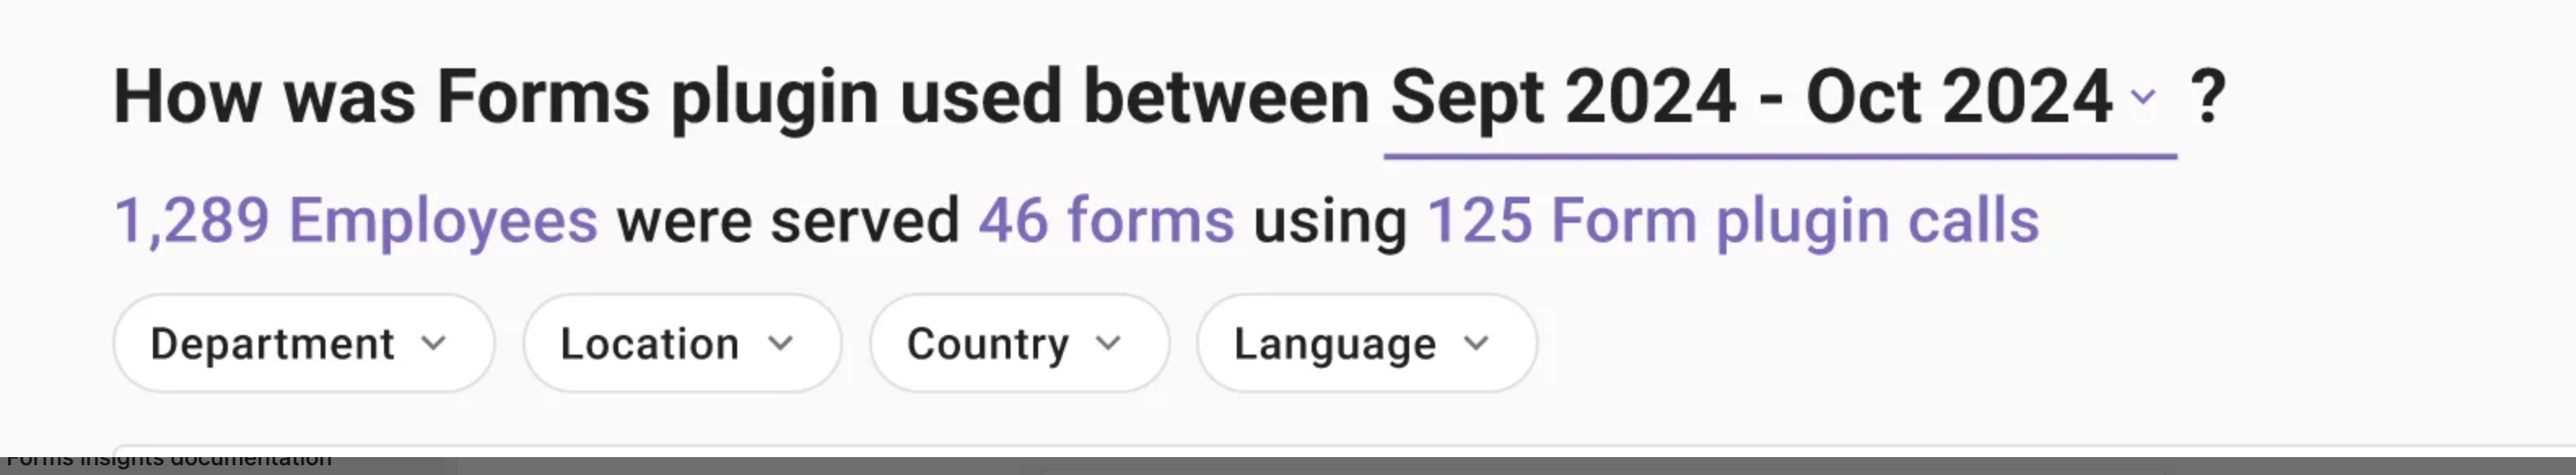
-
This tells you the total number of forms that were surfaced to your employees in the time frame that you have selected along with the number of plugin calls (This refers to user interactions where forms plugin was called by the AI assistant. There can be multiple interactions in the conversation where form plugin can be called )
-
This also tells you about the total employees who have benefitted from form plugin.
I want to see the best and worst performing forms
First, to get a sense of how many and what forms are ingested, head over to MW Setup > Ingested forms.
Head over to the below widget in Forms insights under plugin insights.
TIP: Search using the form name in MW Setup under Ingested Forms to get the form link
- This widget will give you information about all the forms that were surfaced to your employees in the selected time frame.
- Sort by total interactions (top right corner of the widget) to see the most served forms. Move to the last page to see the least served forms.
- Sort by Marked unhelpful, to see all interactions where the form was served but the user marked AI Assistant response as unhelpful.
On what topics should more forms be created ?
Head over to the below widget in Forms insights , under Plugin insights.
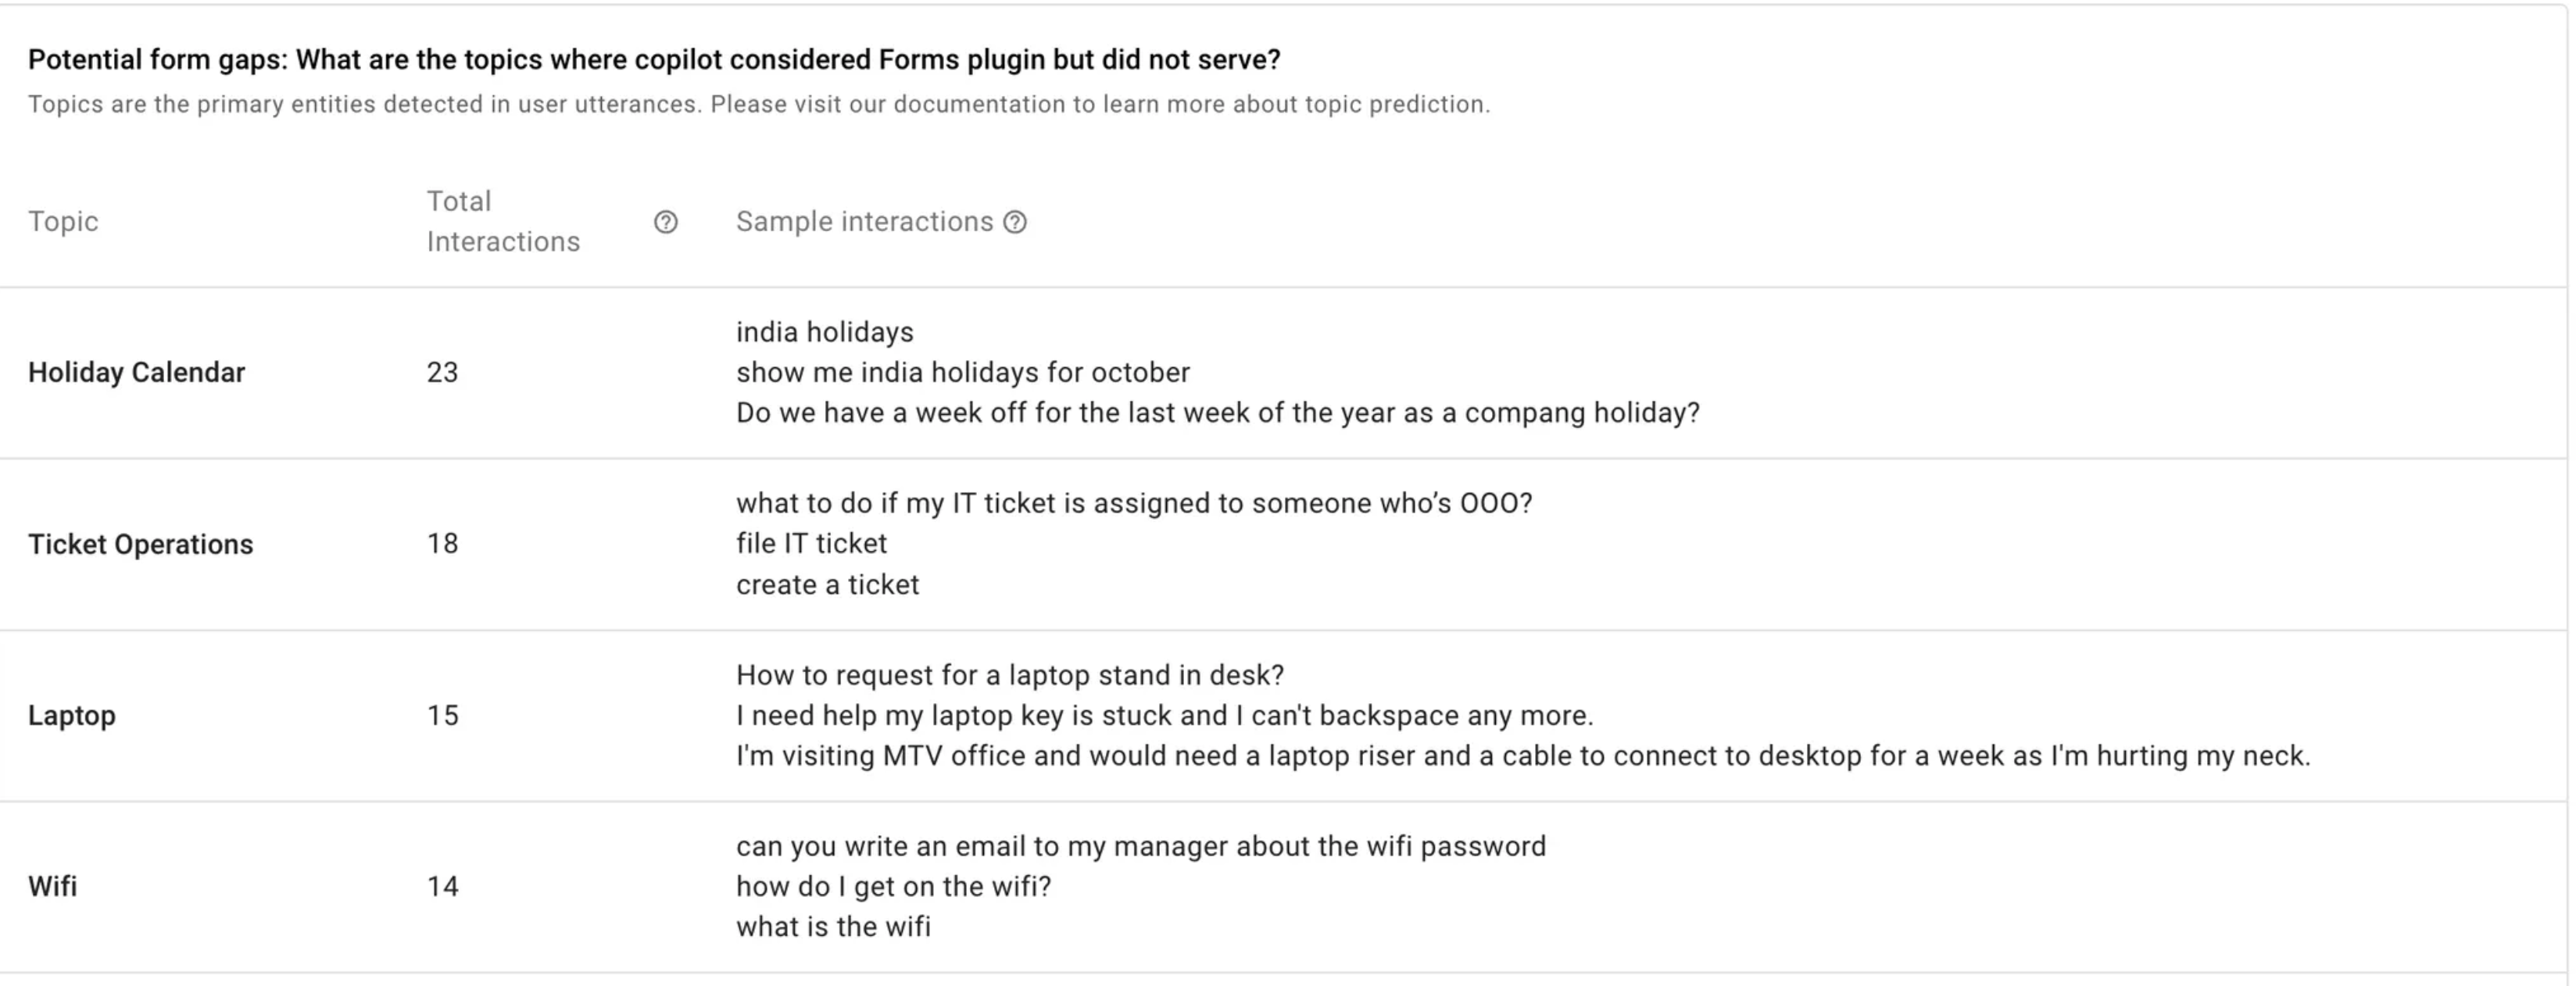
- This table gives you a list of topics that might contribute to a form gap. Please note that this widget is prescriptive in nature and gives you a starting point to your own form gap analysis.
- The sample interactions give you a quick context of what the users are asking around that topic.
Troubleshooting and FAQ’s
What is the data refresh policy on this dashboard?
AI Assistant conversation data is processed on a daily basis and is updated by 4:00 PM (PT) every day for the previous day's data. The demographic data, such as user department and location, is fetched from the user identity ingestion process, which runs approximately every 4 to 6 hours (Please note: The schedule for the identity ingestion pipeline can be configured differently for your organization).
Why this dashboard is not visible to few users?
Please ensure the user has the “Bot analytics admin” or “Bot analytics viewer” role to access the dashboard. You can provide user the required role using the RBAC tool.
Why the dashboard is taking too much time to load ?
The latency for the dashboard is dependent on the selected time interval. If you see longer load times and failure in loading dashboard please reach out to the Moveworks support team.
Updated 9 months ago