User Insights
Overview
The User Insights report is available to all customers with access to AI Assistant Insights. This report provides insights into AI Assistant adoption rates and helps you understand "who is using the AI Assistant?". The report delivers details of users actively engaging with AI Assistant. It provides a distribution based on user attributes such as the surfaces where the user interacts with AI Assistant, their department, location, and preferred language.
🎥 See a walkthrough - Watch this Academy video on User Insights
How to access the report
User insights report is a new addition to AI Assistant insights. You can access this report by expanding the AI Assistant insights tab available in the analytics application on the navigation sidebar.
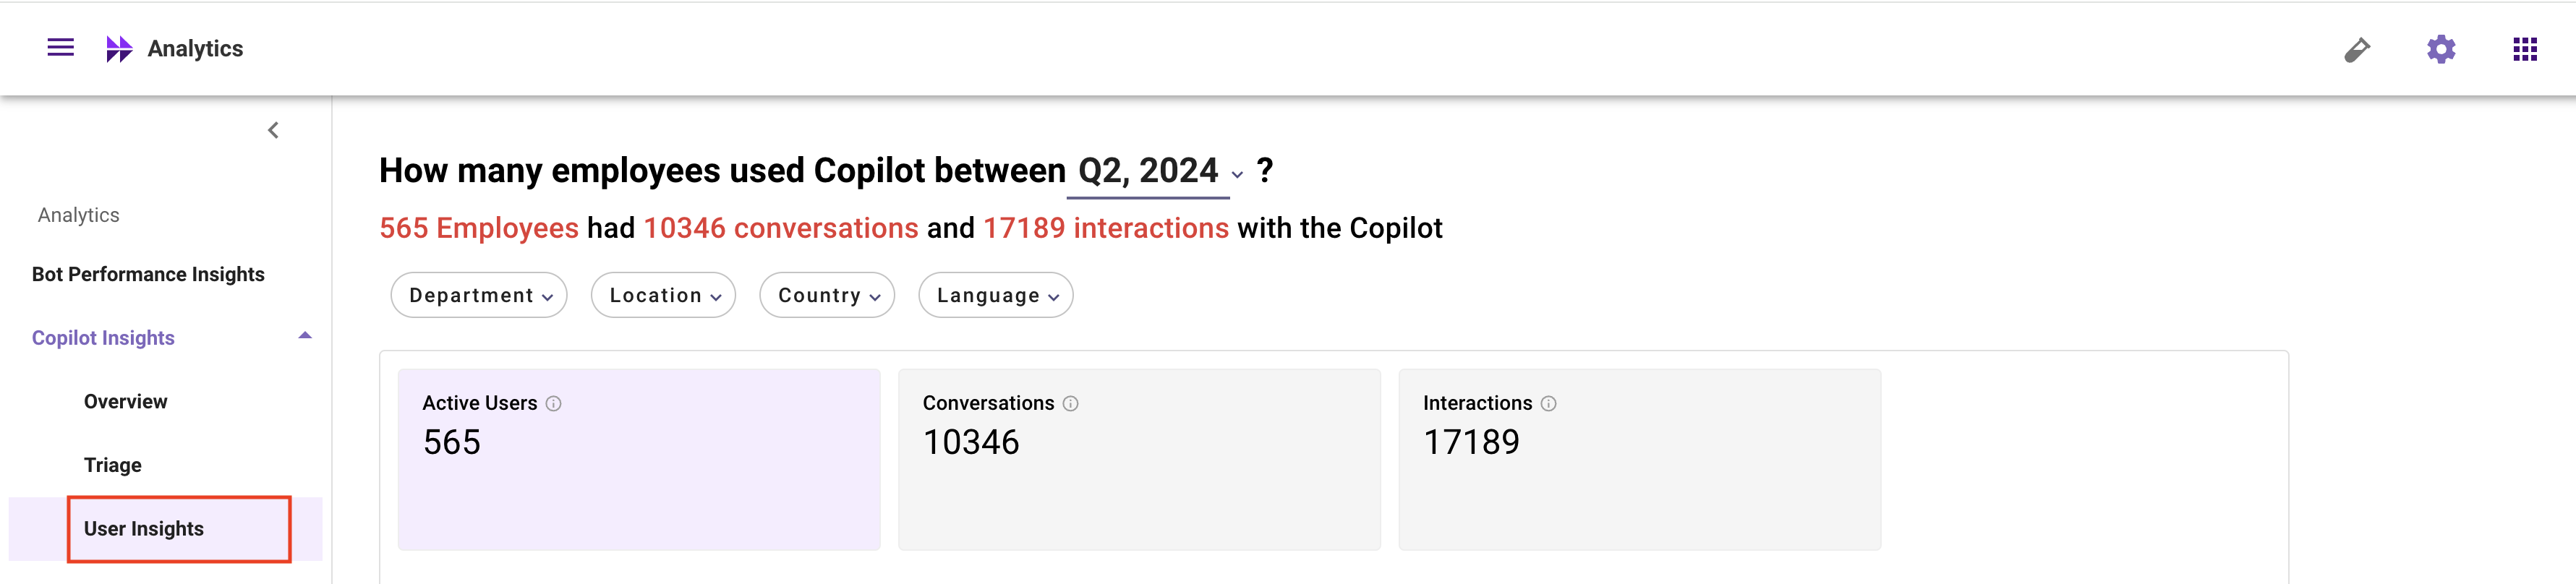
.Users with a “Bot analytics admin” or “Bot analytics viewer” role for the analytics application can access this report. If they don't see this report under the AI Assistant insights tab, please add them using the Roles and Permissions tool.
Key terms used in the report
Key terms | Definition |
|---|---|
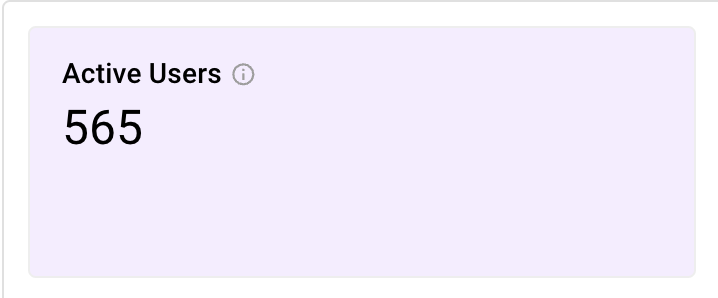
Active users | All users ingested in moveworks who have had at-least 1 interaction with the AI Assistant during the selected time period. |
Conversations | A conversation is defined as a cohesive sequence of interactions between a user and the bot, focusing on a single topic. This approach to defining a conversation emphasizes the thematic continuity across interactions, regardless of the number of distinct issues/queries that may arise within the theme. |
Interactions | All user utterances sent to the AI Assistant, button clicks in the AI Assistant's responses, link clicks in the AI Assistant's responses, file uploads for the Brief-Me plugin, and form submissions are defined as interactions. |
AI Assistant surfaces | Platforms where users can interact with AI Assistant. For example : Slack, Microsoft teams, web surfaces like self-service portals or intranet pages. |
Users with AI Assistant access | Users who have access to AI Assistant and are allowed to have a conversation with the AI Assistant. This is evaluated by the “BOT ACCESS RULE” configured in Moveworks Setup. Visit User identity → Advanced Settings → Skill setting to understand the “BOT ACCESS RULE”. |
User preferred language | Language set by user as their preferred option for interactions with the AI Assistant. US English (EN US) is used as the default option if the users has not selected a preferred language. Visit here to learn about the multi-lingual support. |
Filters and widget types
The User insights report allows you to filter AI Assistant adoption data for a given time period, department, location, country and based on user preferred language.
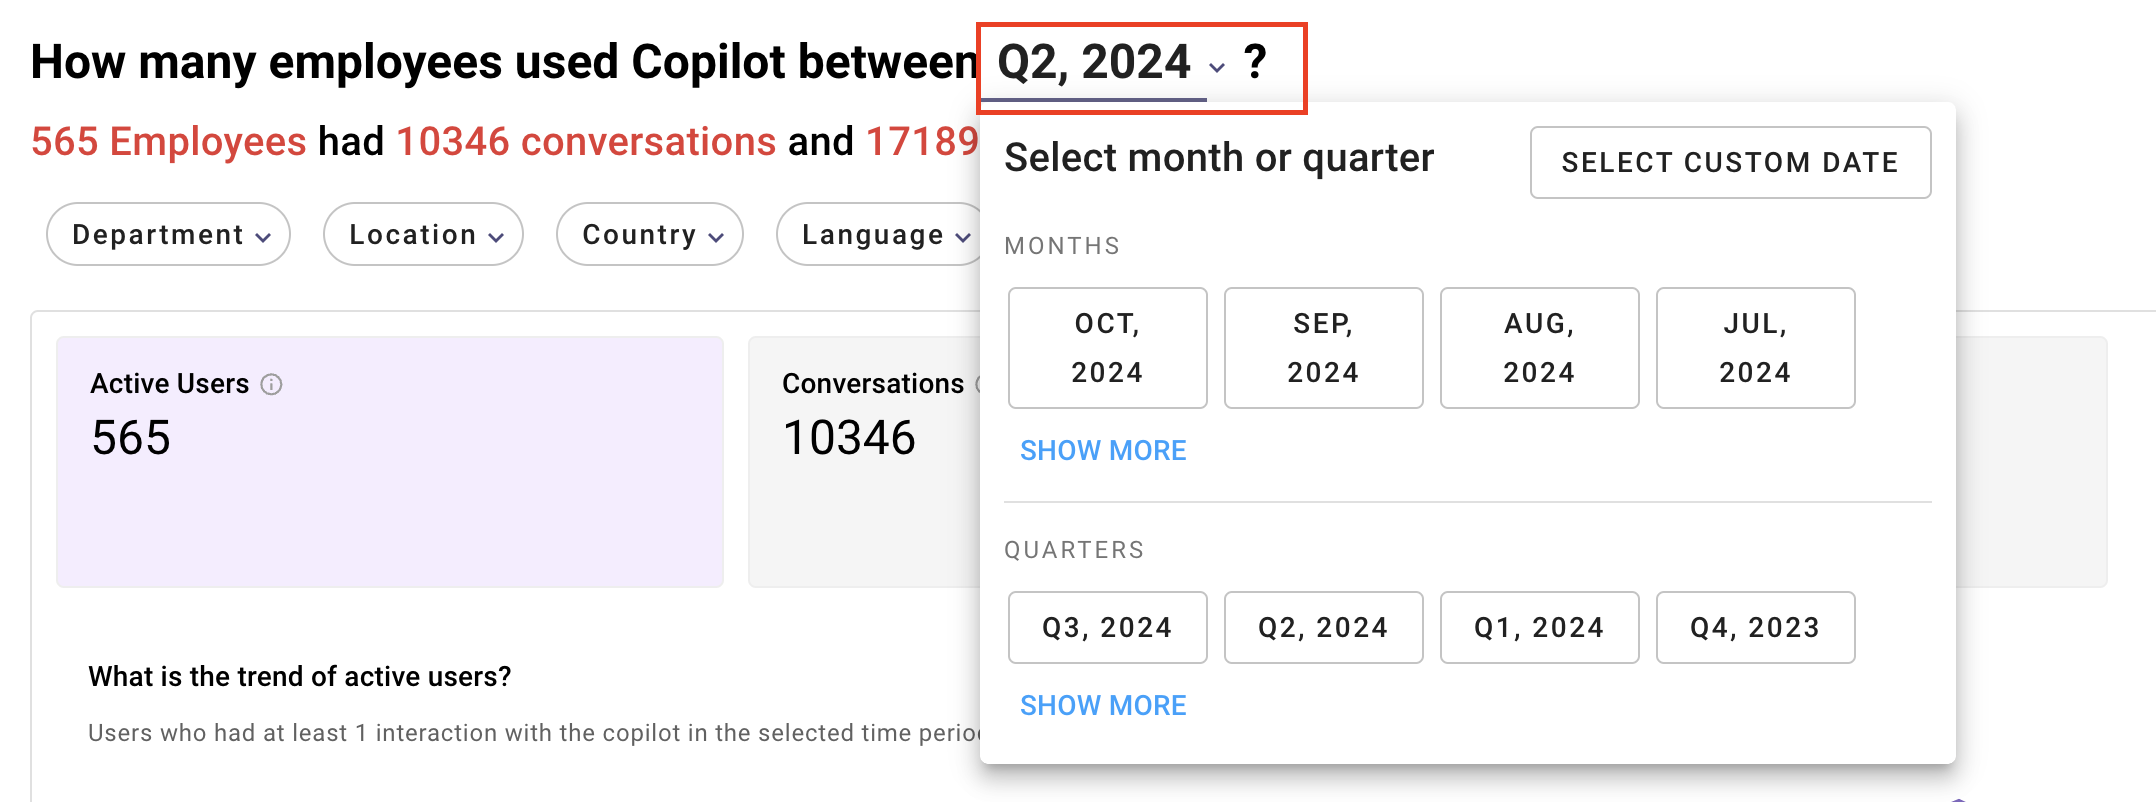
Select date interval for which you want to review the AI Assistant adoption data
By default the report show adoption data for previous 30 days. This can be changed using the date interval selection. You can select previous months (or) quarters using the selection available in the dropdown.
The report also allows custom date interval selection. You can access that using the “select custom date” button.
Please note, if you are choosing custom dates, the report data will be projected up to one day before the chosen end date.
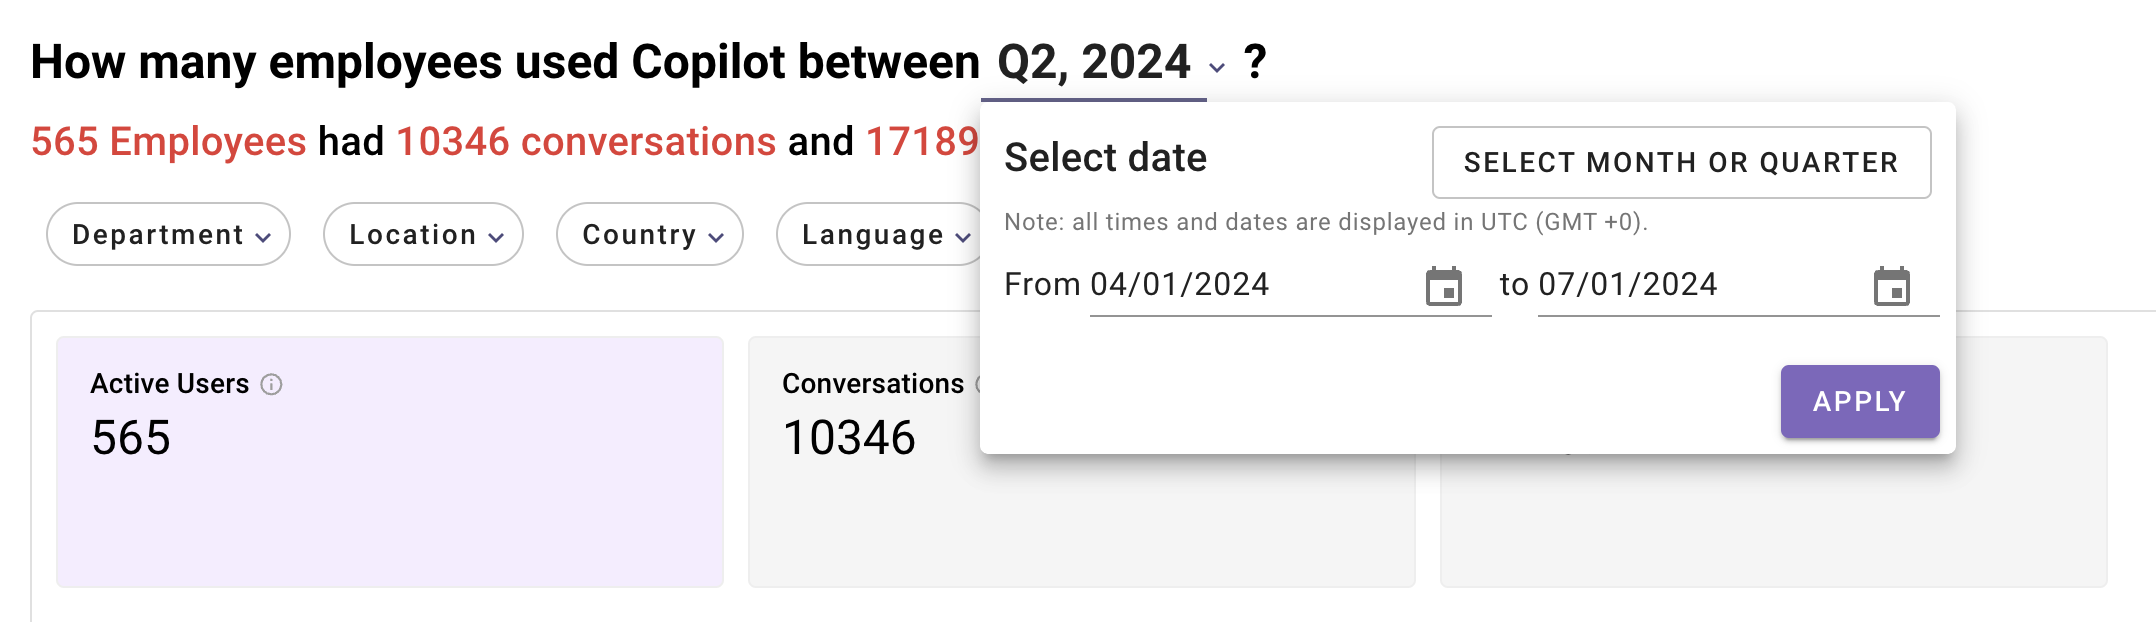
The User Insights report displays data from the time the AI Assistant was introduced within your organization. However, the time period selections allows a maximum time period of 2 years.
Select department/ location/ country/ language for which you want review the AI Assistant adoption data
User insights report provides 4 top level filters which can used to filter the data
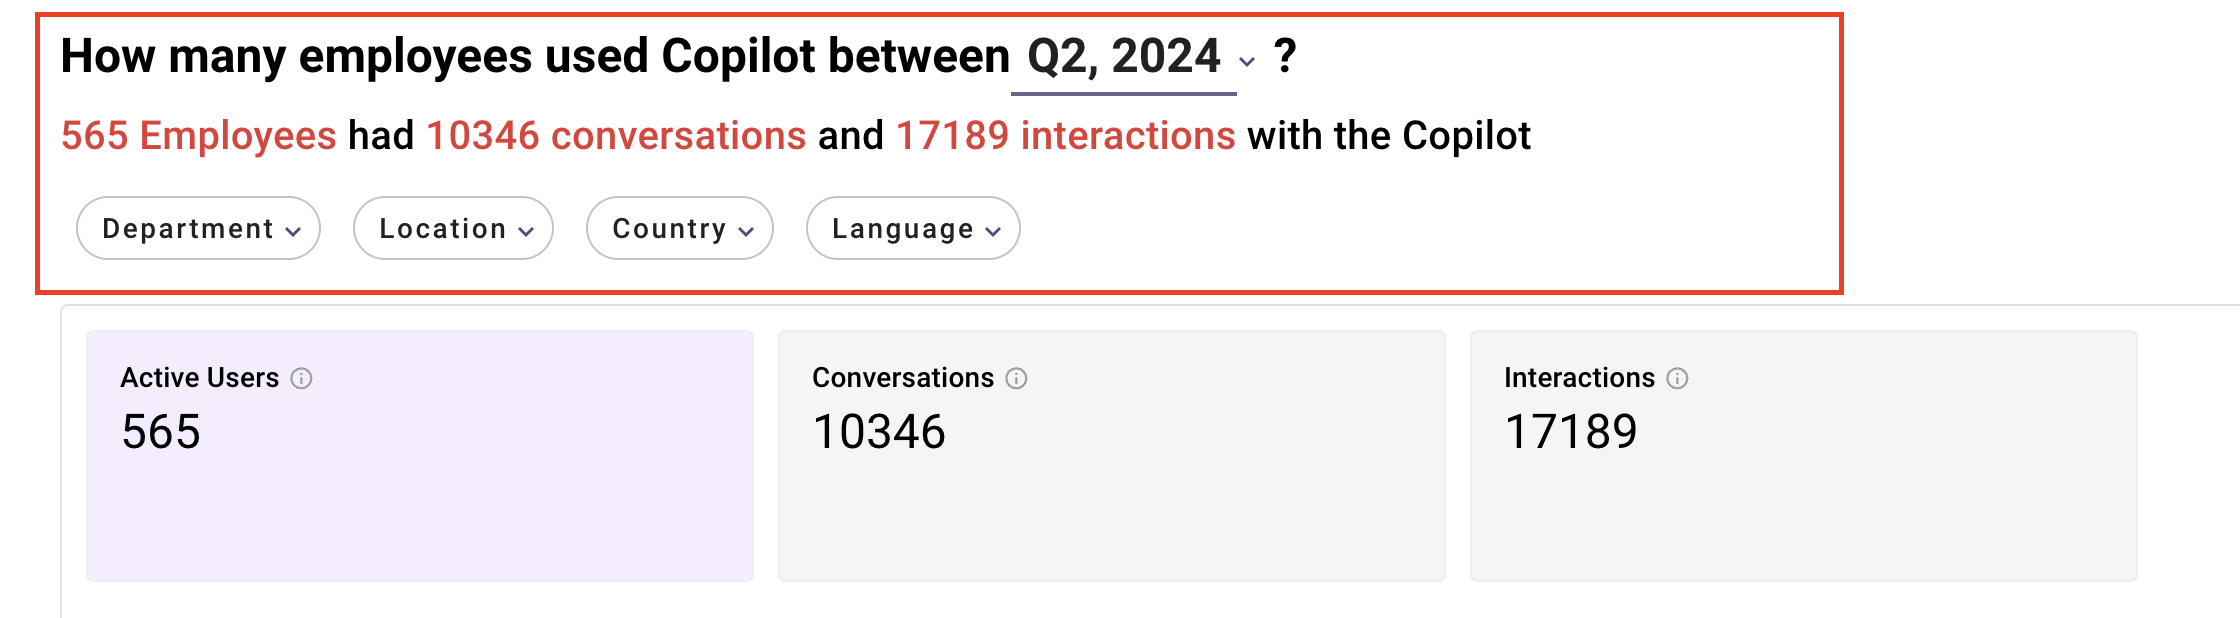
The department/location/country value is ingested from your external system used in user identity. Please refer here to learn more on user identity ingestion.
Example use-case : I want to see the conversations trend for the sales department
Select the department dropdown and search for sales department
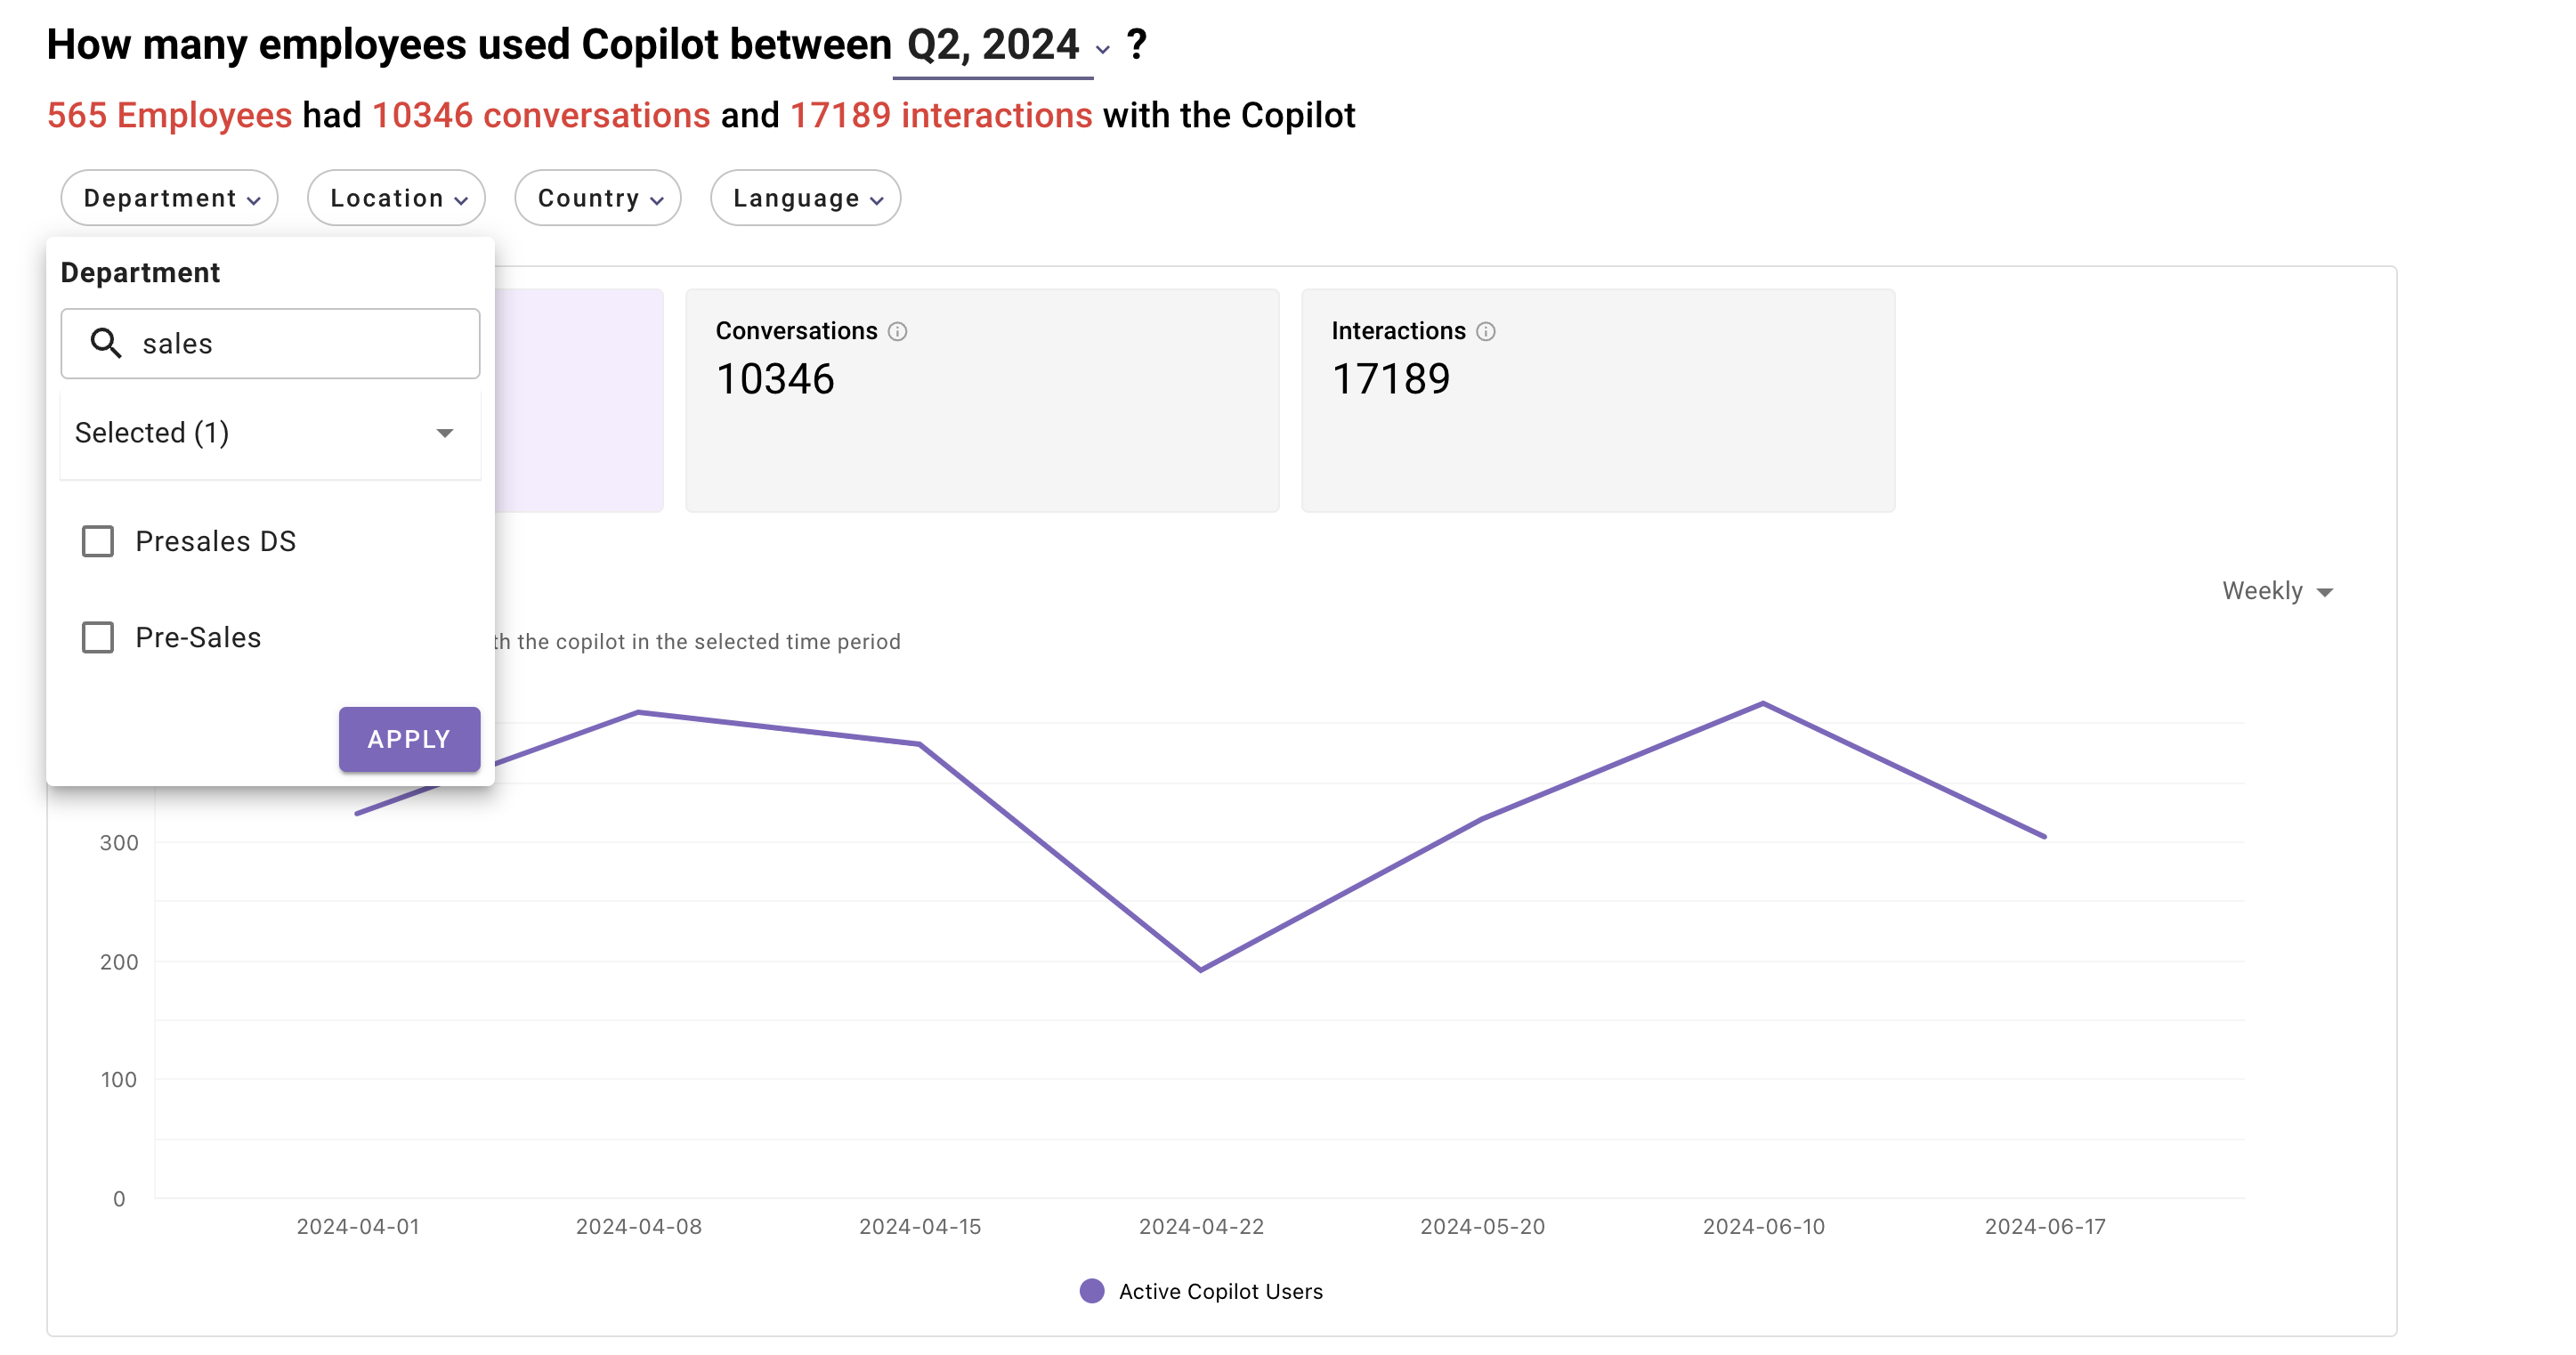
Once the filter is applied all metrics will only be shown for the sales department.
Widget types used in this report
- Summary metric
A simple widget which shows the total value for a given metric based on a set formula. For example: total number of active users in a given time interval
- Trend chart
Line chart or Bar chart that presents the values of one or more metrics over a period of time, with selectable time intervals (day, week, month). For example: trend of active user over a selected time interval.
The day, week, month breakdown is only visible for a selected time interval
| View type | Minimum time interval | Maximum time interval |
|---|---|---|
| Daily | 1 Day | 30 Days |
| Weekly | 2 Weeks | 26 Weeks |
| Monthly | 1 Month | 24 Months |
- Table
A tabular list of one or more dimensions and their metrics. For example: Active users breakdown by user preferred language. Table can be sorted by the available columns. Today, only descending sort is supported which will be applied once the user has selected the column name in the sort option (top-right of the widget).

Deep dive into widgets
Active users / Conversations / Interactions tab
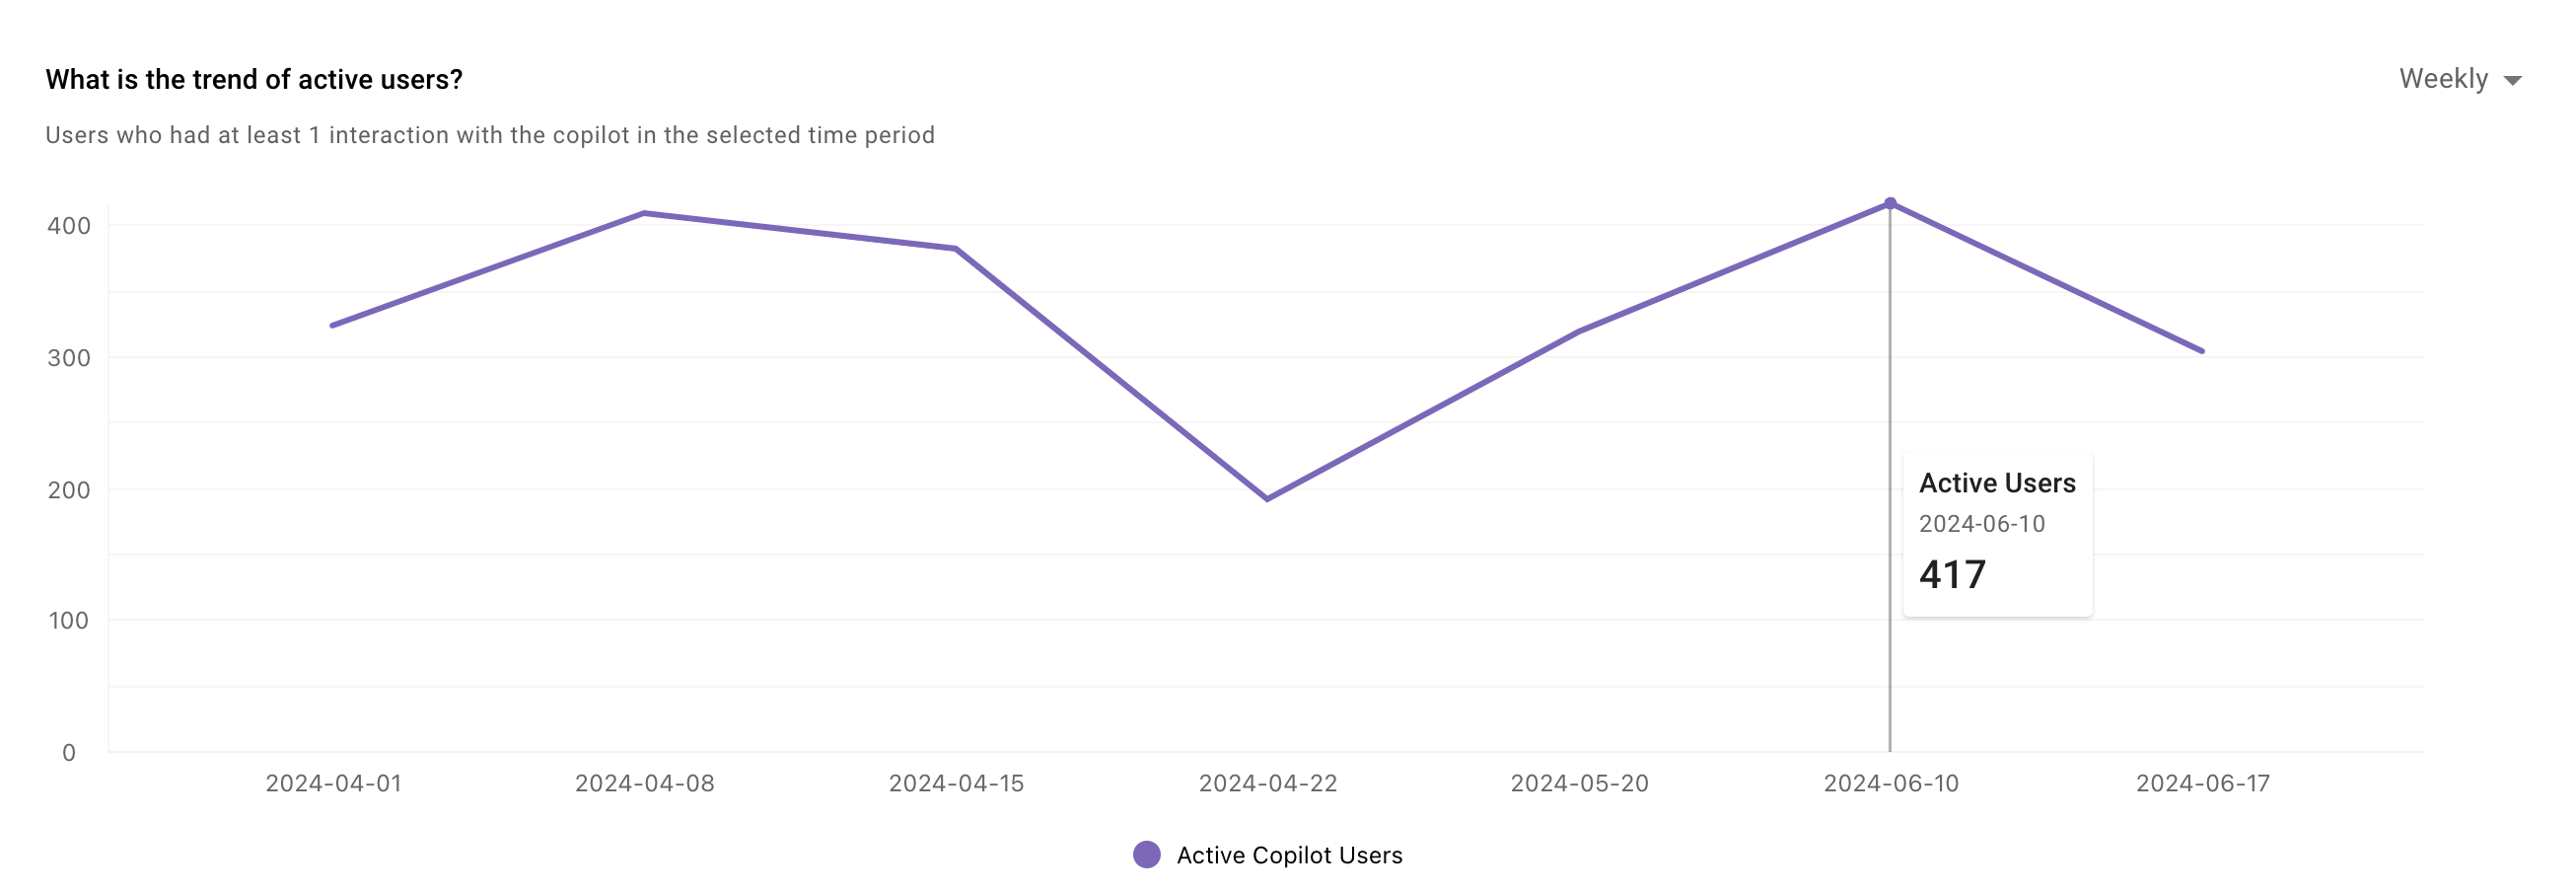
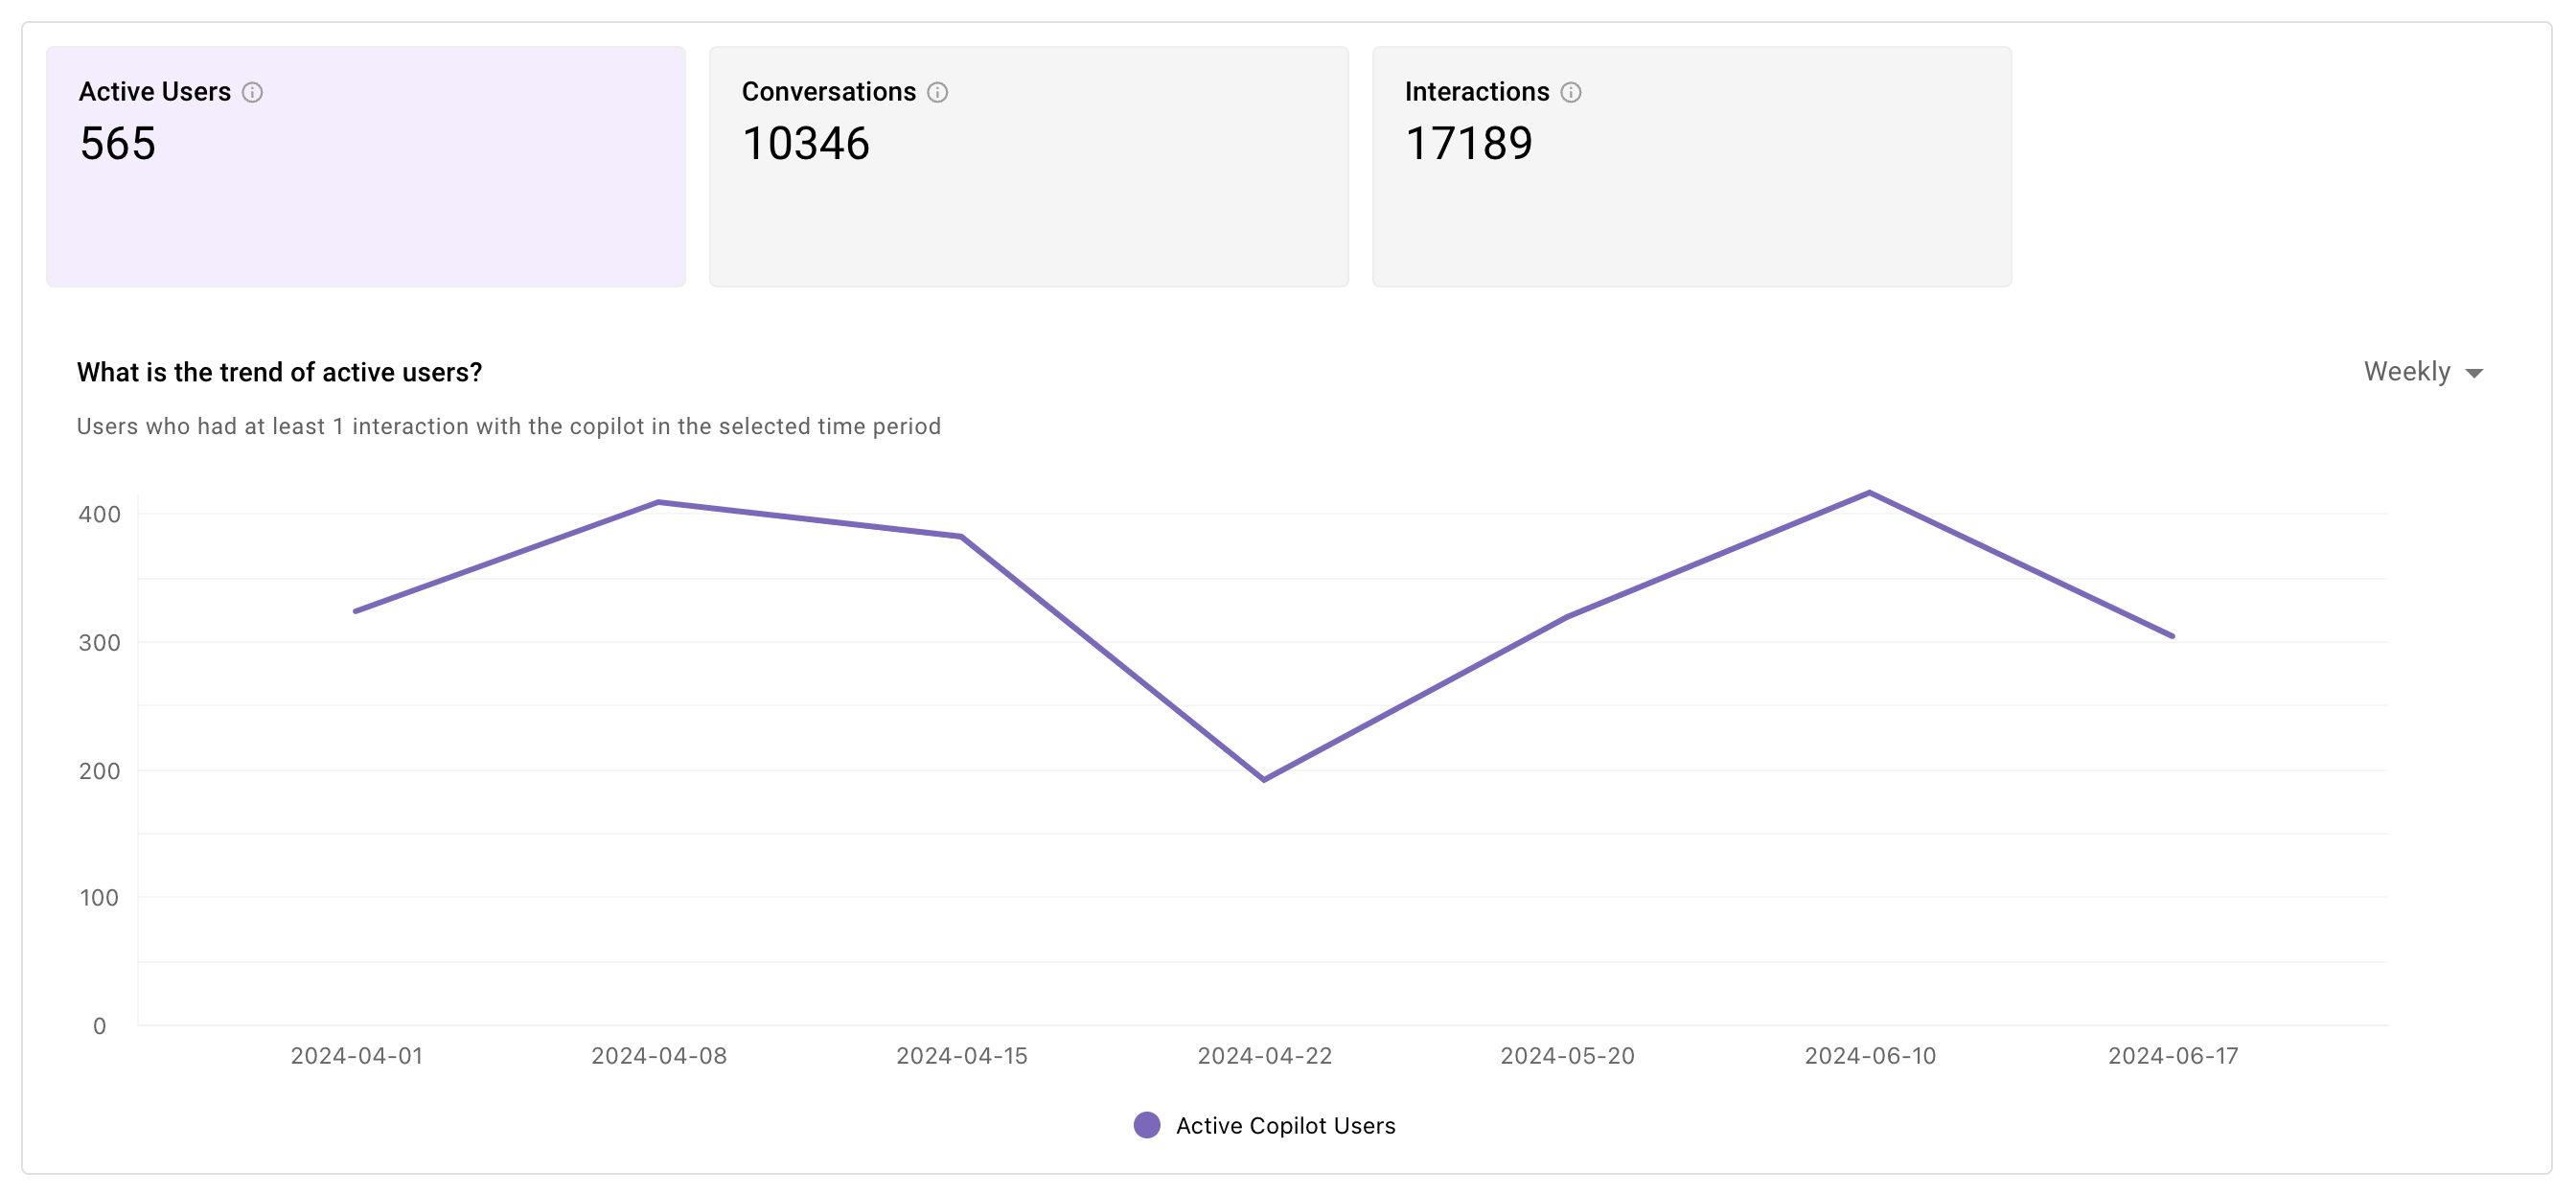
This widget provides total number of active users/ total conversations/ total interactions in the selected time interval. The trend chart also shows active users/conversations/interactions distribution over the selected time period. The time interval can be customized by daily/weekly/monthly breakdown.
Evaluating AI Assistant adoption through active user analysis or conversations and interactions analysis provides insights into user behavior and helps understand the user engagement with the AI Assistant.
The total number of active users does not equal the sum of weekly/monthly values in the trend chart because a user active in more than one week/month is counted as active in each week/month they appear.
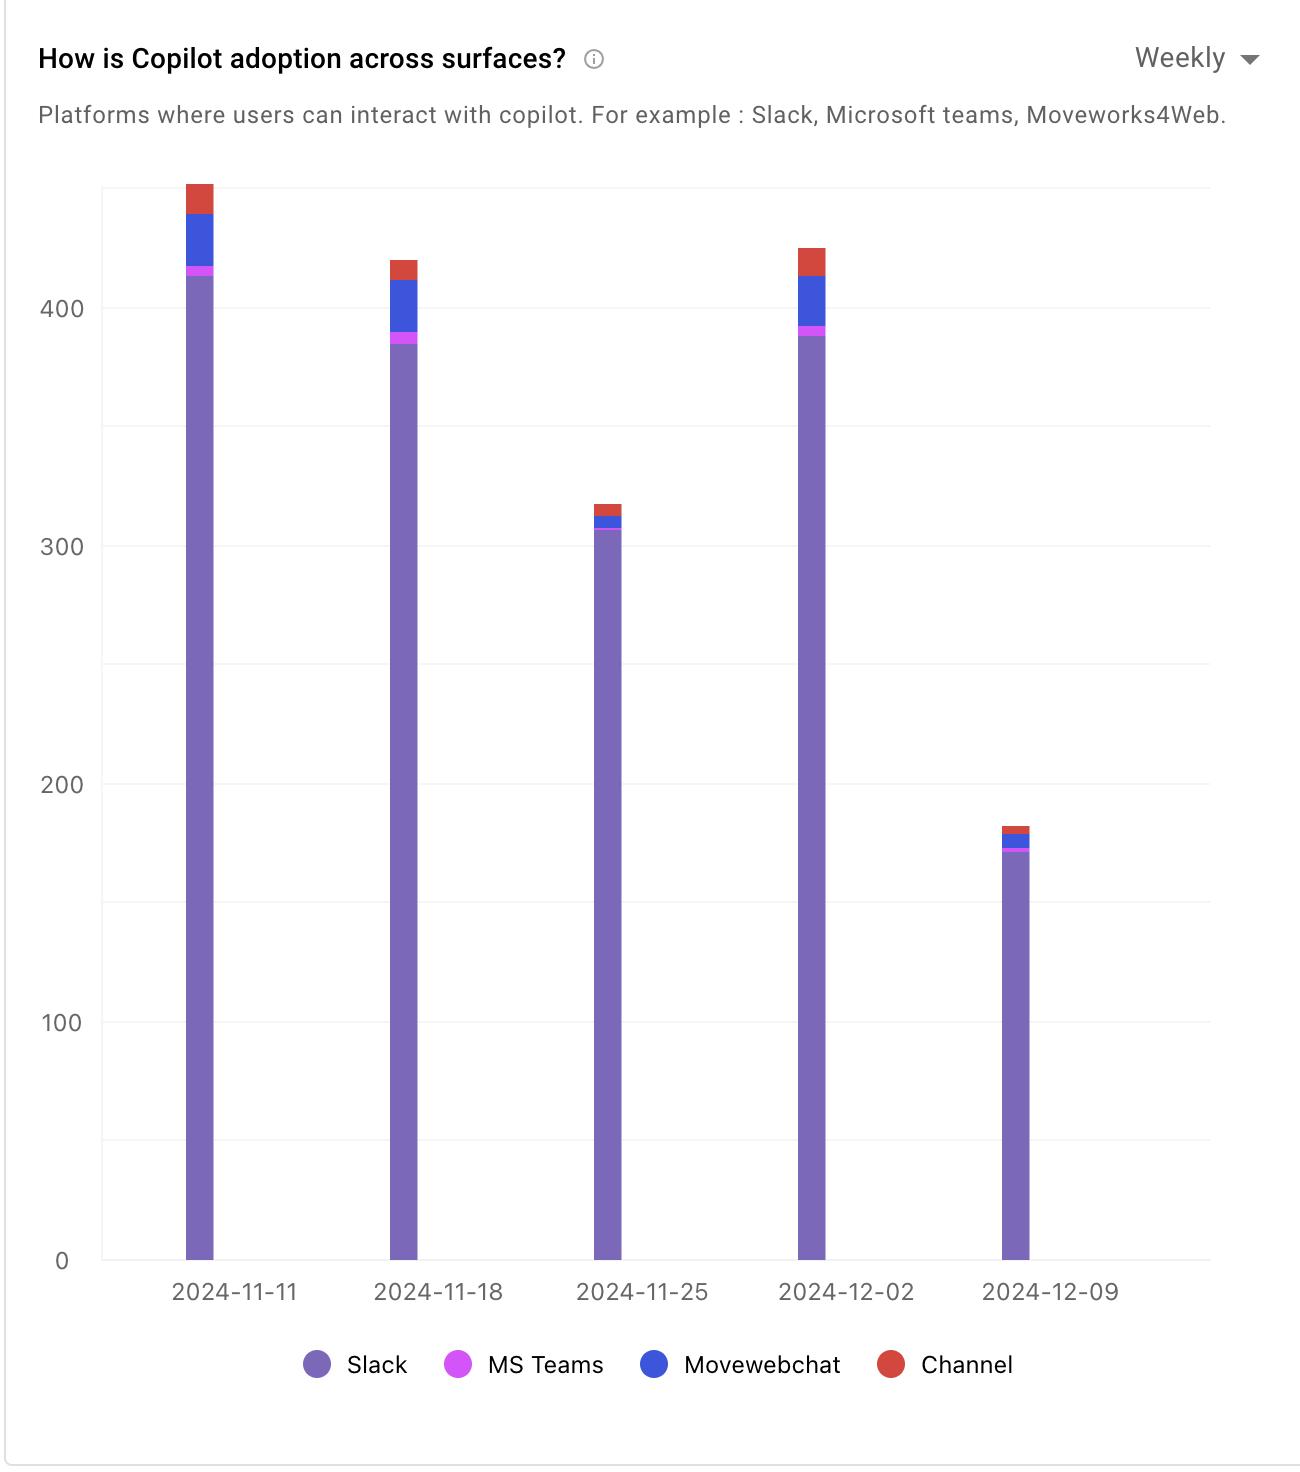
AI Assistant adoption across surfaces
This widget shows active users breakdown over the different surfaces (where AI Assistant is deployed). The time interval can be customized by daily/weekly/monthly breakdown. This widget only shows platforms where active interactions are recorded in a given period of time.
When evaluating AI Assistant usage across multiple deployed platforms such as slack and moveworks for web this widget helps in understanding the user preference and awareness for each platform enabled.
The surfaces are categorized into individual chat platforms(Slack, Teams), Moveworkswebchat (AI Assistant enabled web surfaces like self-service portals or intranet pages.), Channel (All slack channels where channel resolver is configured).
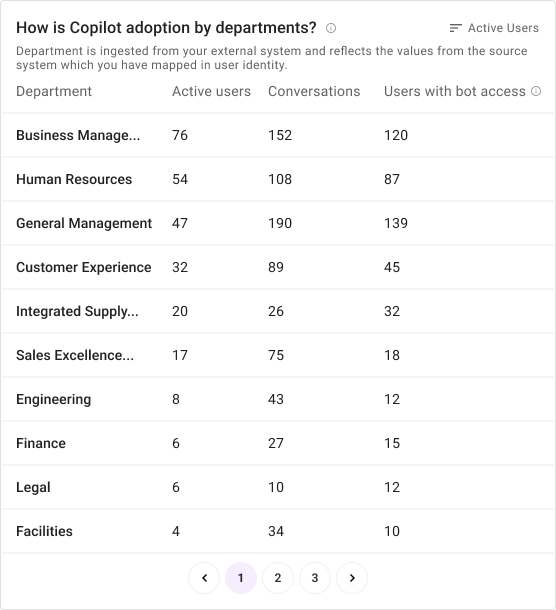
AI Assistant adoption by department & location
These widgets shows the active users breakdown by department or location. The table displays the department/location, active users, conversations and users with AI Assistant access as different columns. This allows in understanding the AI Assistant adoption by individual department or by a given region. Please note the values for department and region are ingested from your external system and reflects the values from the source system which you have mapped in user identity. Please refer here to learn more on user identity ingestion. These widgets unlock the reporting of adoption on the basis of user demographic data.
User with AI Assistant access represents users who have enabled with AI Assistant at the end of the selected time period. This depends on the AI Assistant access rule configuration made in moveworks setup. You can refer to this configuration in User identity → Advance settings → Skill settings.
You might see “n/a” or blank department or location values. This is due to the data being missing in the external system and Moveworks was not able to ingest value for this attribute.
Please update the department and location data in your external system so the correct values get reflected in these widgets.
The values in “Users with AI Assistant access” column in this widget can be lower than active users as “Users with AI Assistant access” column reflects the latest status of the users and is updated with every identity ingestion run.
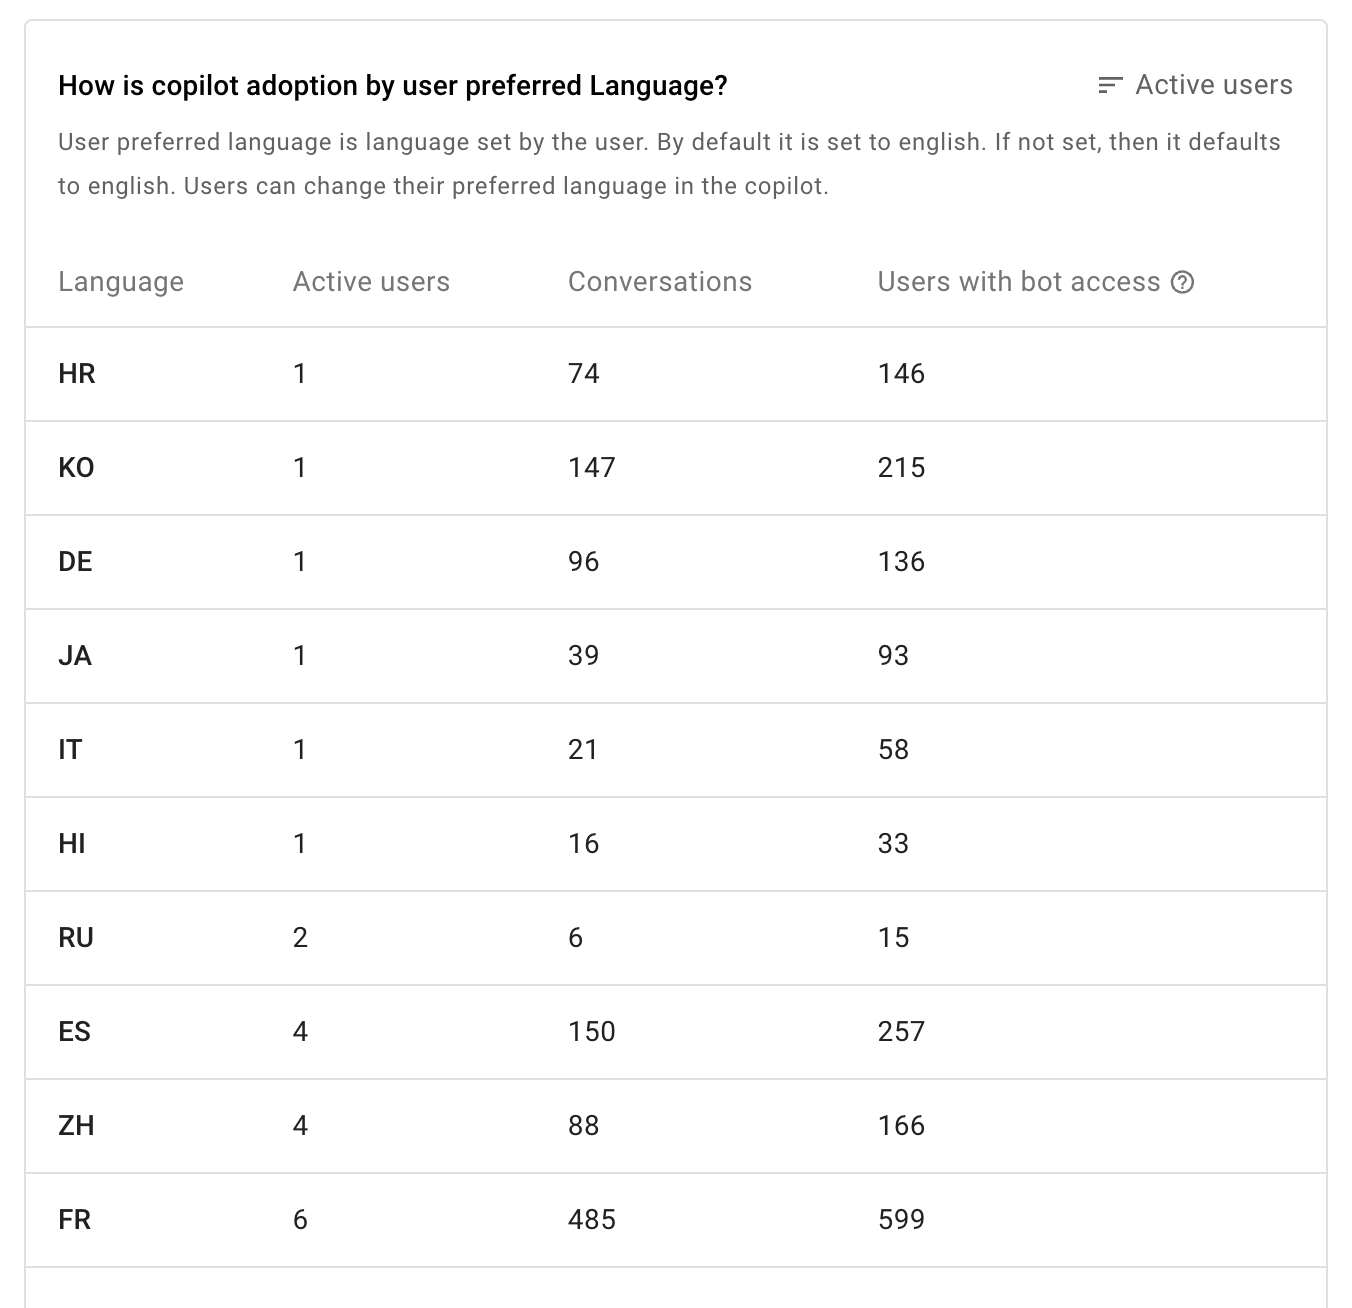
AI Assistant adoption by user preferred language
This widget shows active users breakdown by user preferred language. The table displays the user preferred language selected in AI Assistant, active users who have had conversations in that language, total conversations for a language and number of AI Assistant enabled users who have selected the given language as their user preferred language.
EN_US is the default value set by the system if the user did not update the user preferred language. Please note a user can be counted twice in different languages as they can update their language preference during the selected time interval.
The values in “Users with AI Assistant access” column in this widget can be lower than active users as “Users with AI Assistant access” column reflects the latest status of the users and is updated with every identity ingestion run.
Please visit here to learn more about the languages supported in AI Assistant.
What are key questions i can answer using this report?
Which types of users are less active in using AI Assistant and require additional support?
Inactive users can be identified through user demographic details such as department, location (or) user preferred language. Filter specific widgets to find the low adopters (significant users with AI Assistant access but less active users in a given time period).
Table widget allows the filtering on each column. Please select the “Active users” column, this will list down the data in a descending format. You can find the department, locations, and user preferred language now where “user with AI Assistant access” is significantly greater than active users.
Find users in departments and location with low adoption.
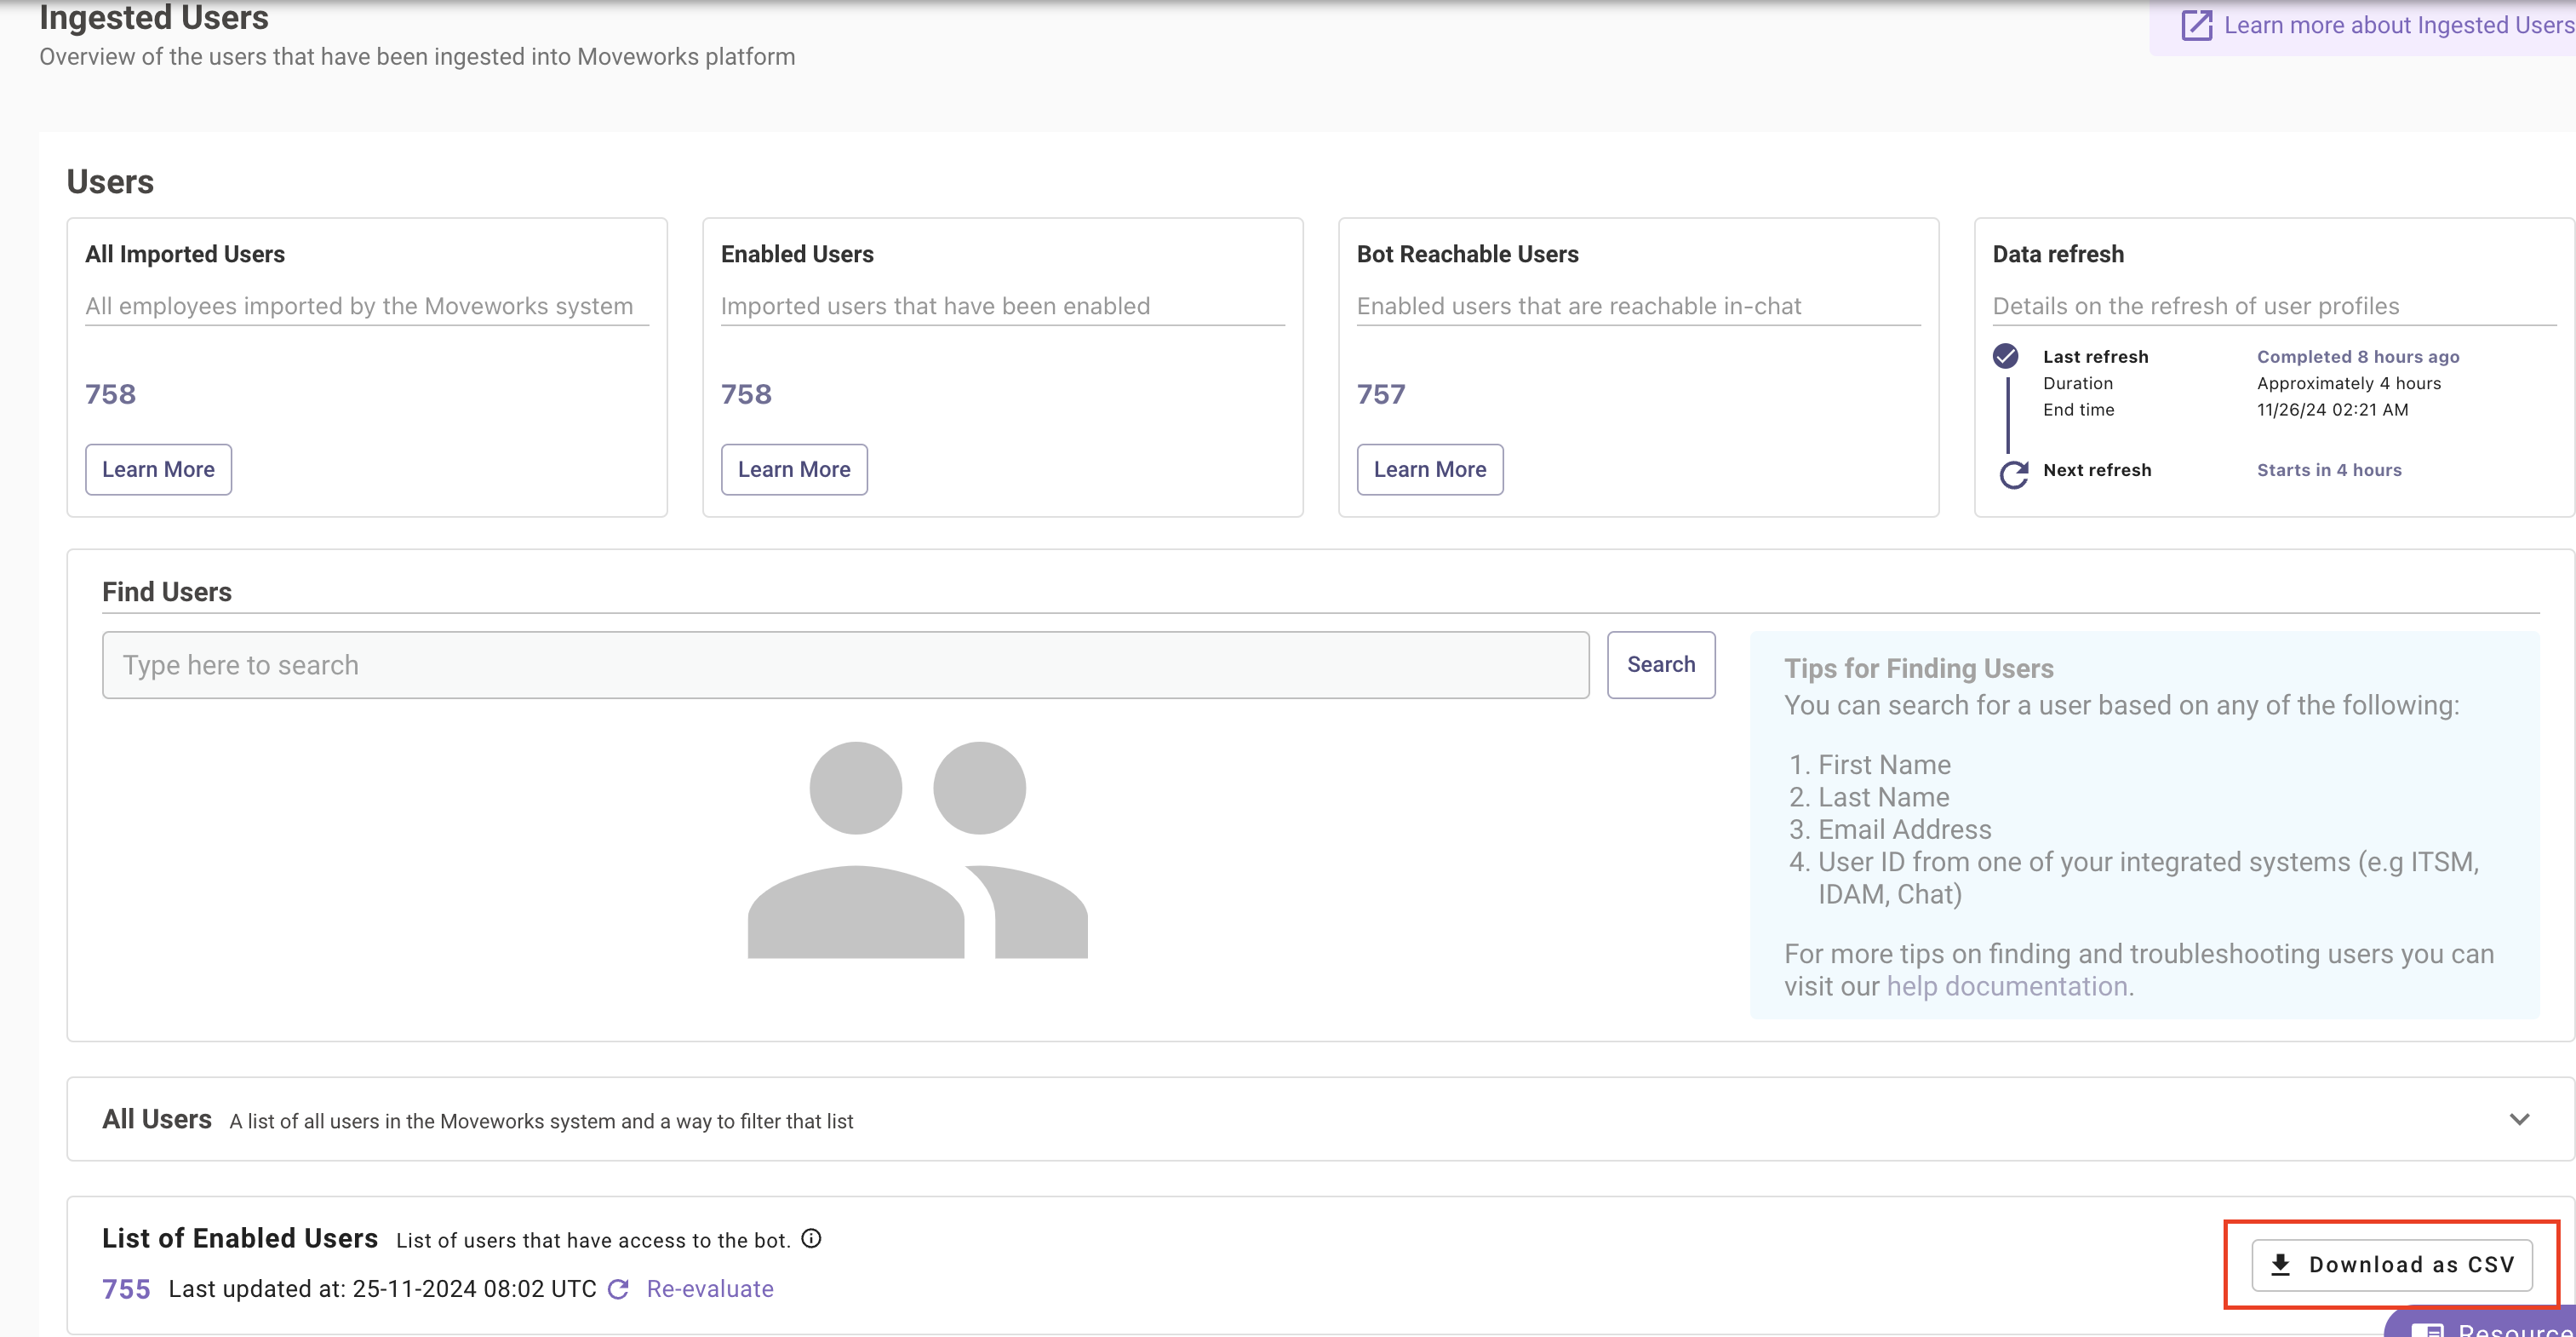
Full list of users with AI Assistant access can be downloaded from “Ingested users” page in Moveworks Setup. This list provides the department/location and the email for each user which can be used to send activation campaigns message. Learn more about employee comms here.
How do I find the unique users who had interaction with AI Assistant during the given time period ?
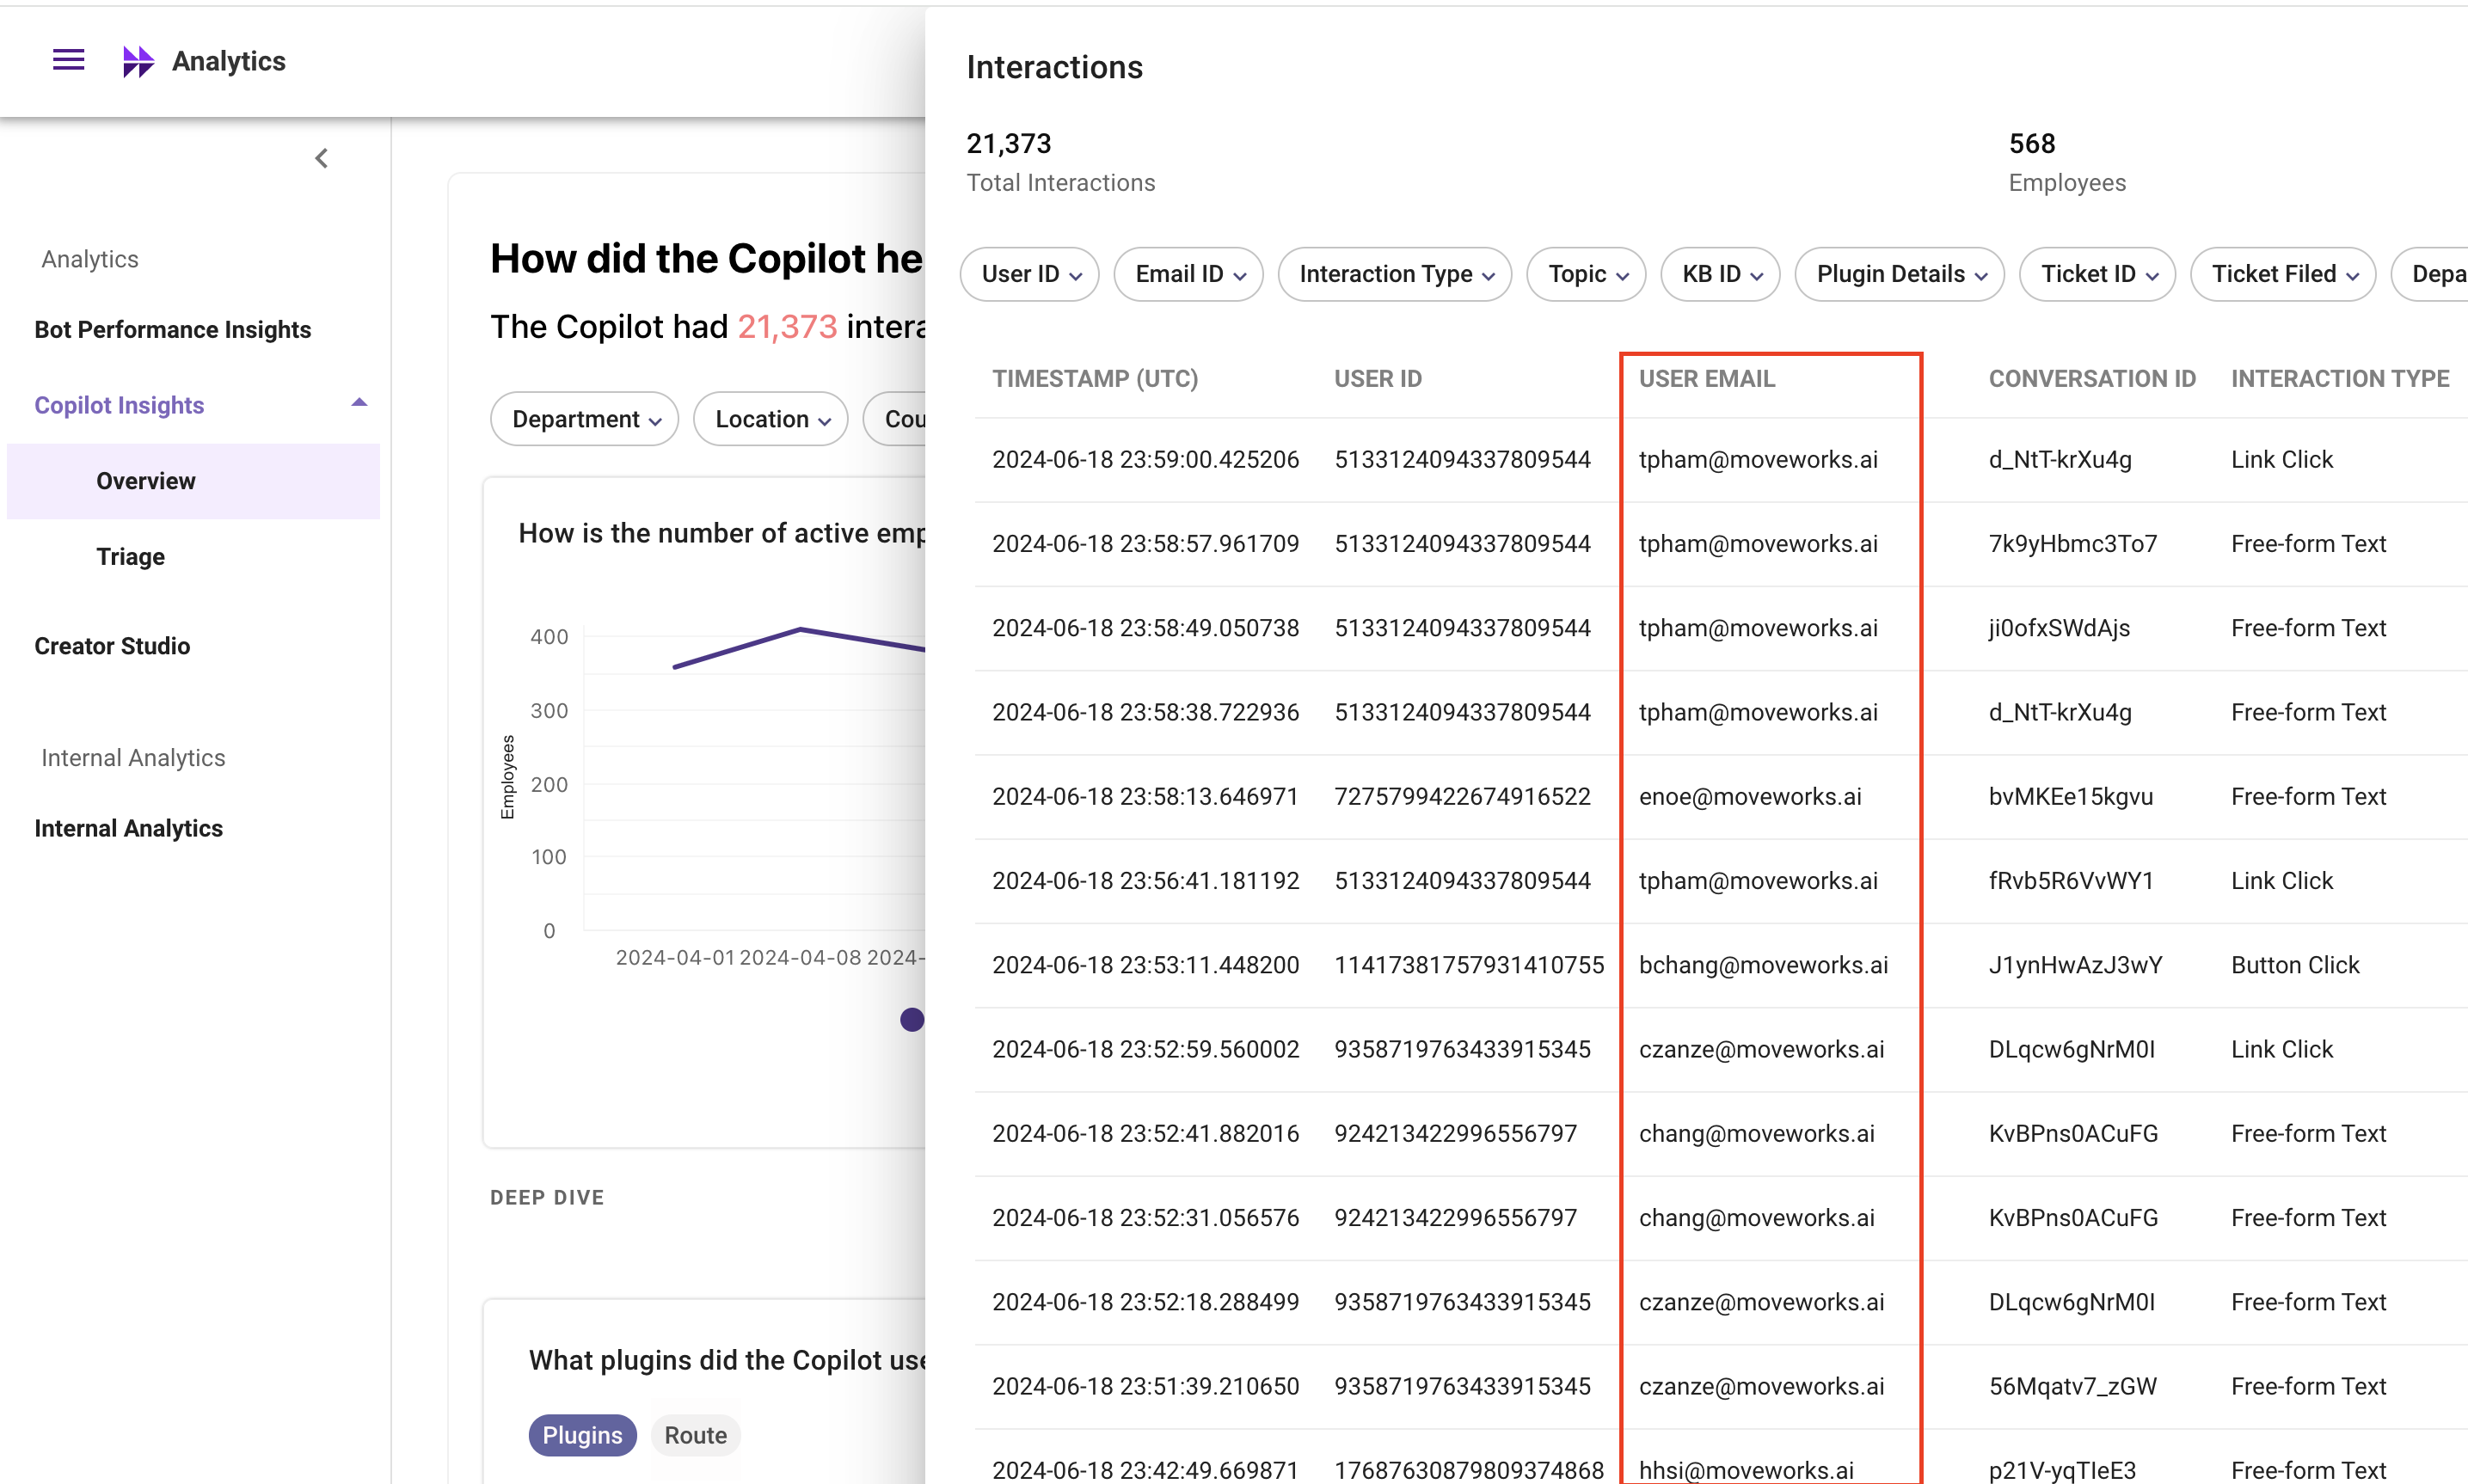
To understand the unique users, please visit the “overview page” in AI Assistant insights report and visit the interaction table. From here, you can view (or) export the interaction table and find the active user details such as email, department, location etc.
Please note the user email will be repeated in the web UI as each row refers to individual interaction done by the end user.
How do I find which external attributes are used to store user department and location ?
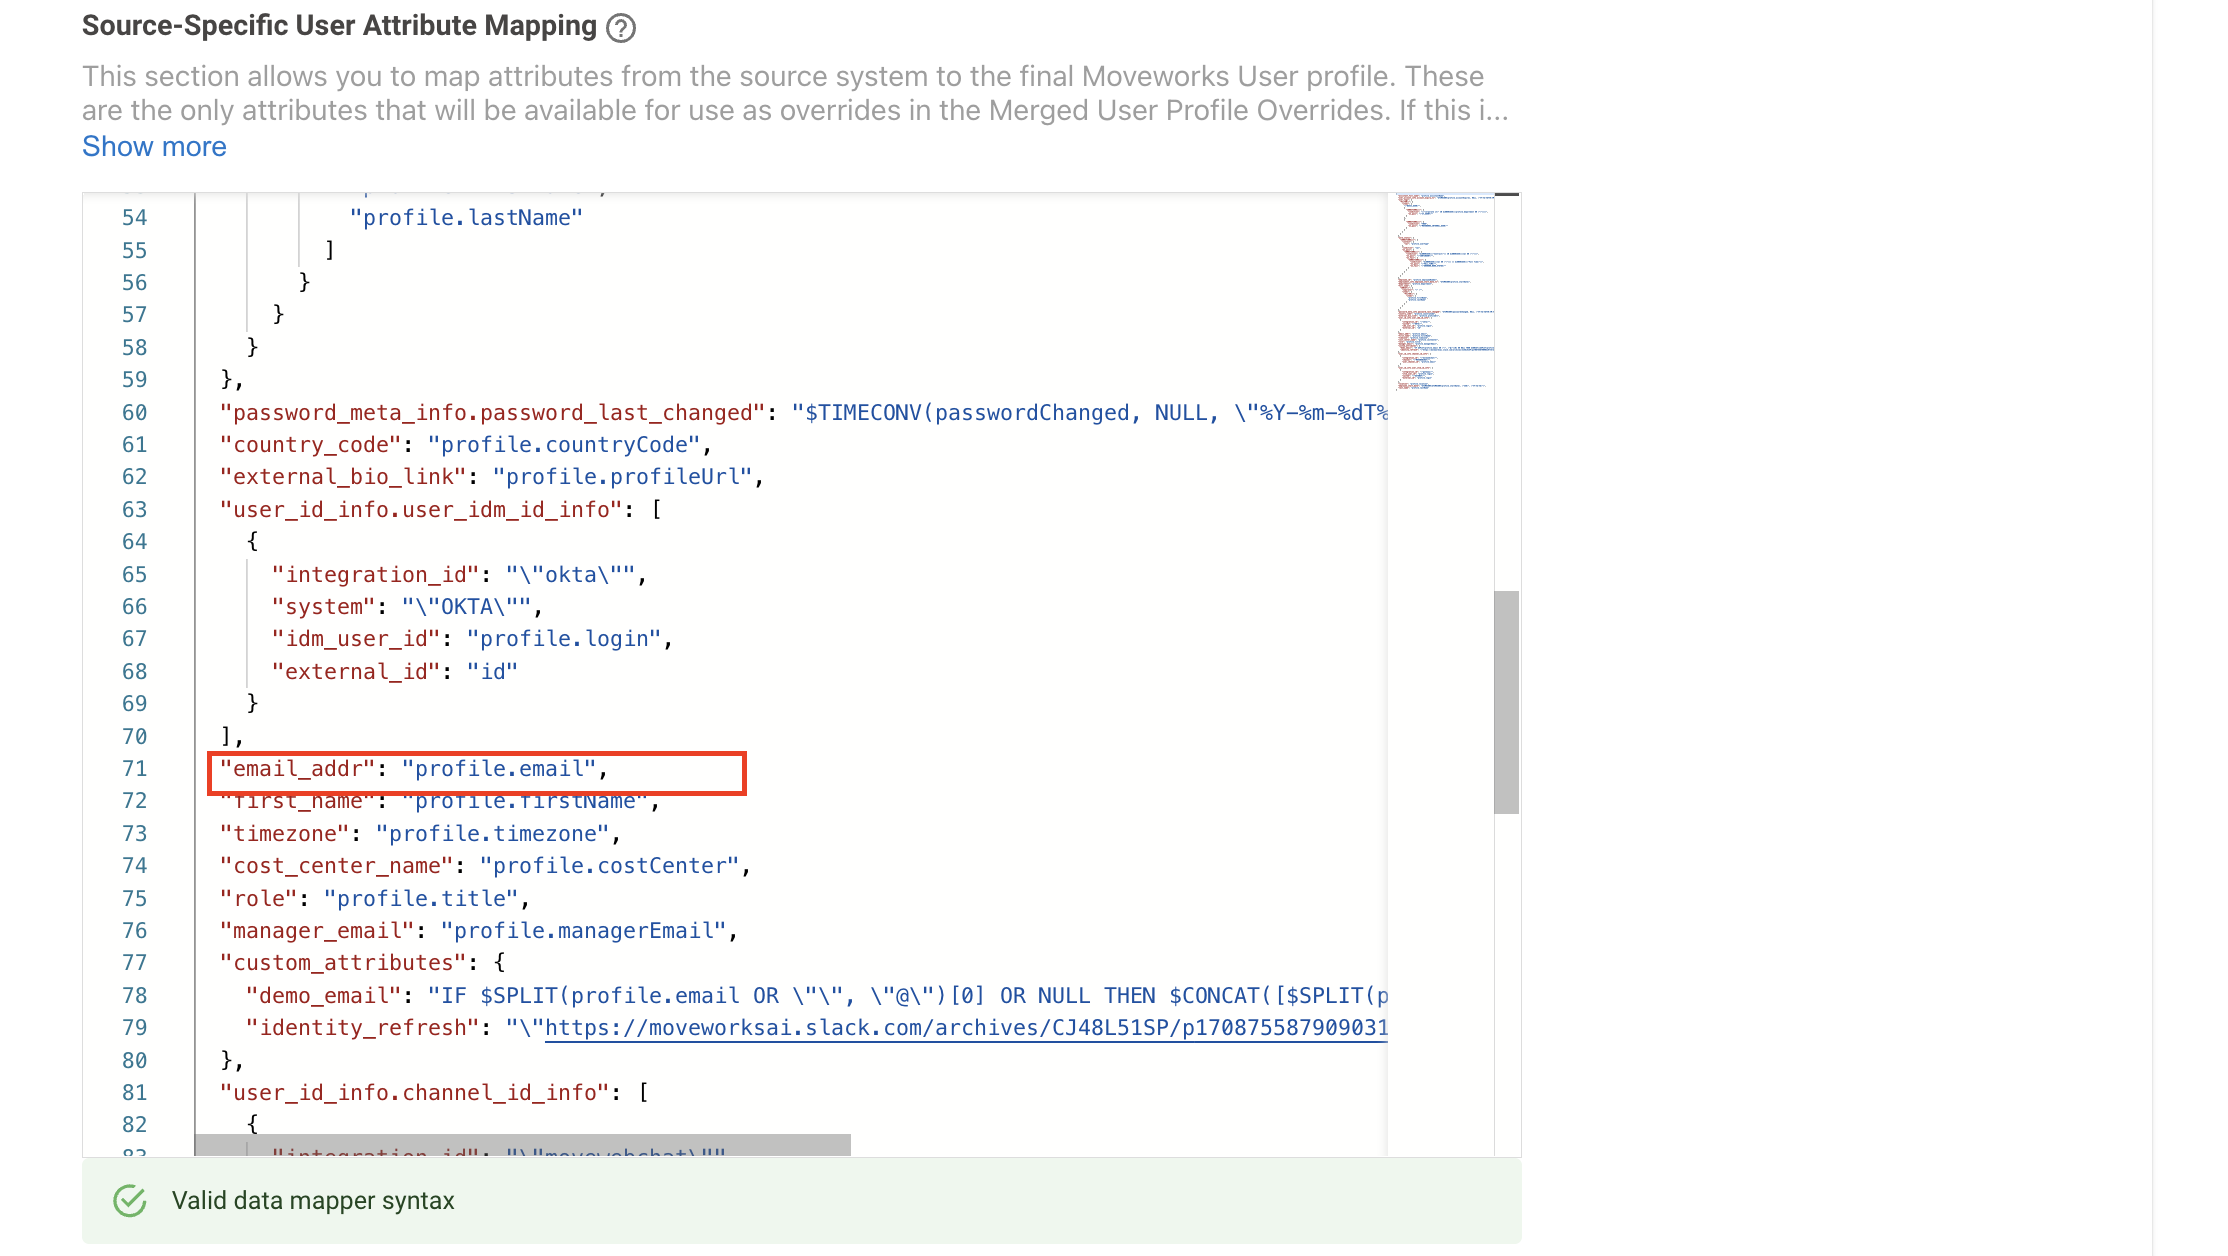
The department and location are populated from the external system. You can visit “Ingest users” section in moveworks setup to learn more on the mapping of these fields with external system fields.
You need to switch to the advanced mode and go through “Source-Specific User Attribute Mapping” for each source configured in identity mapping. This screen provides details on the external system attribute which you can update to improve the department and location coverage.
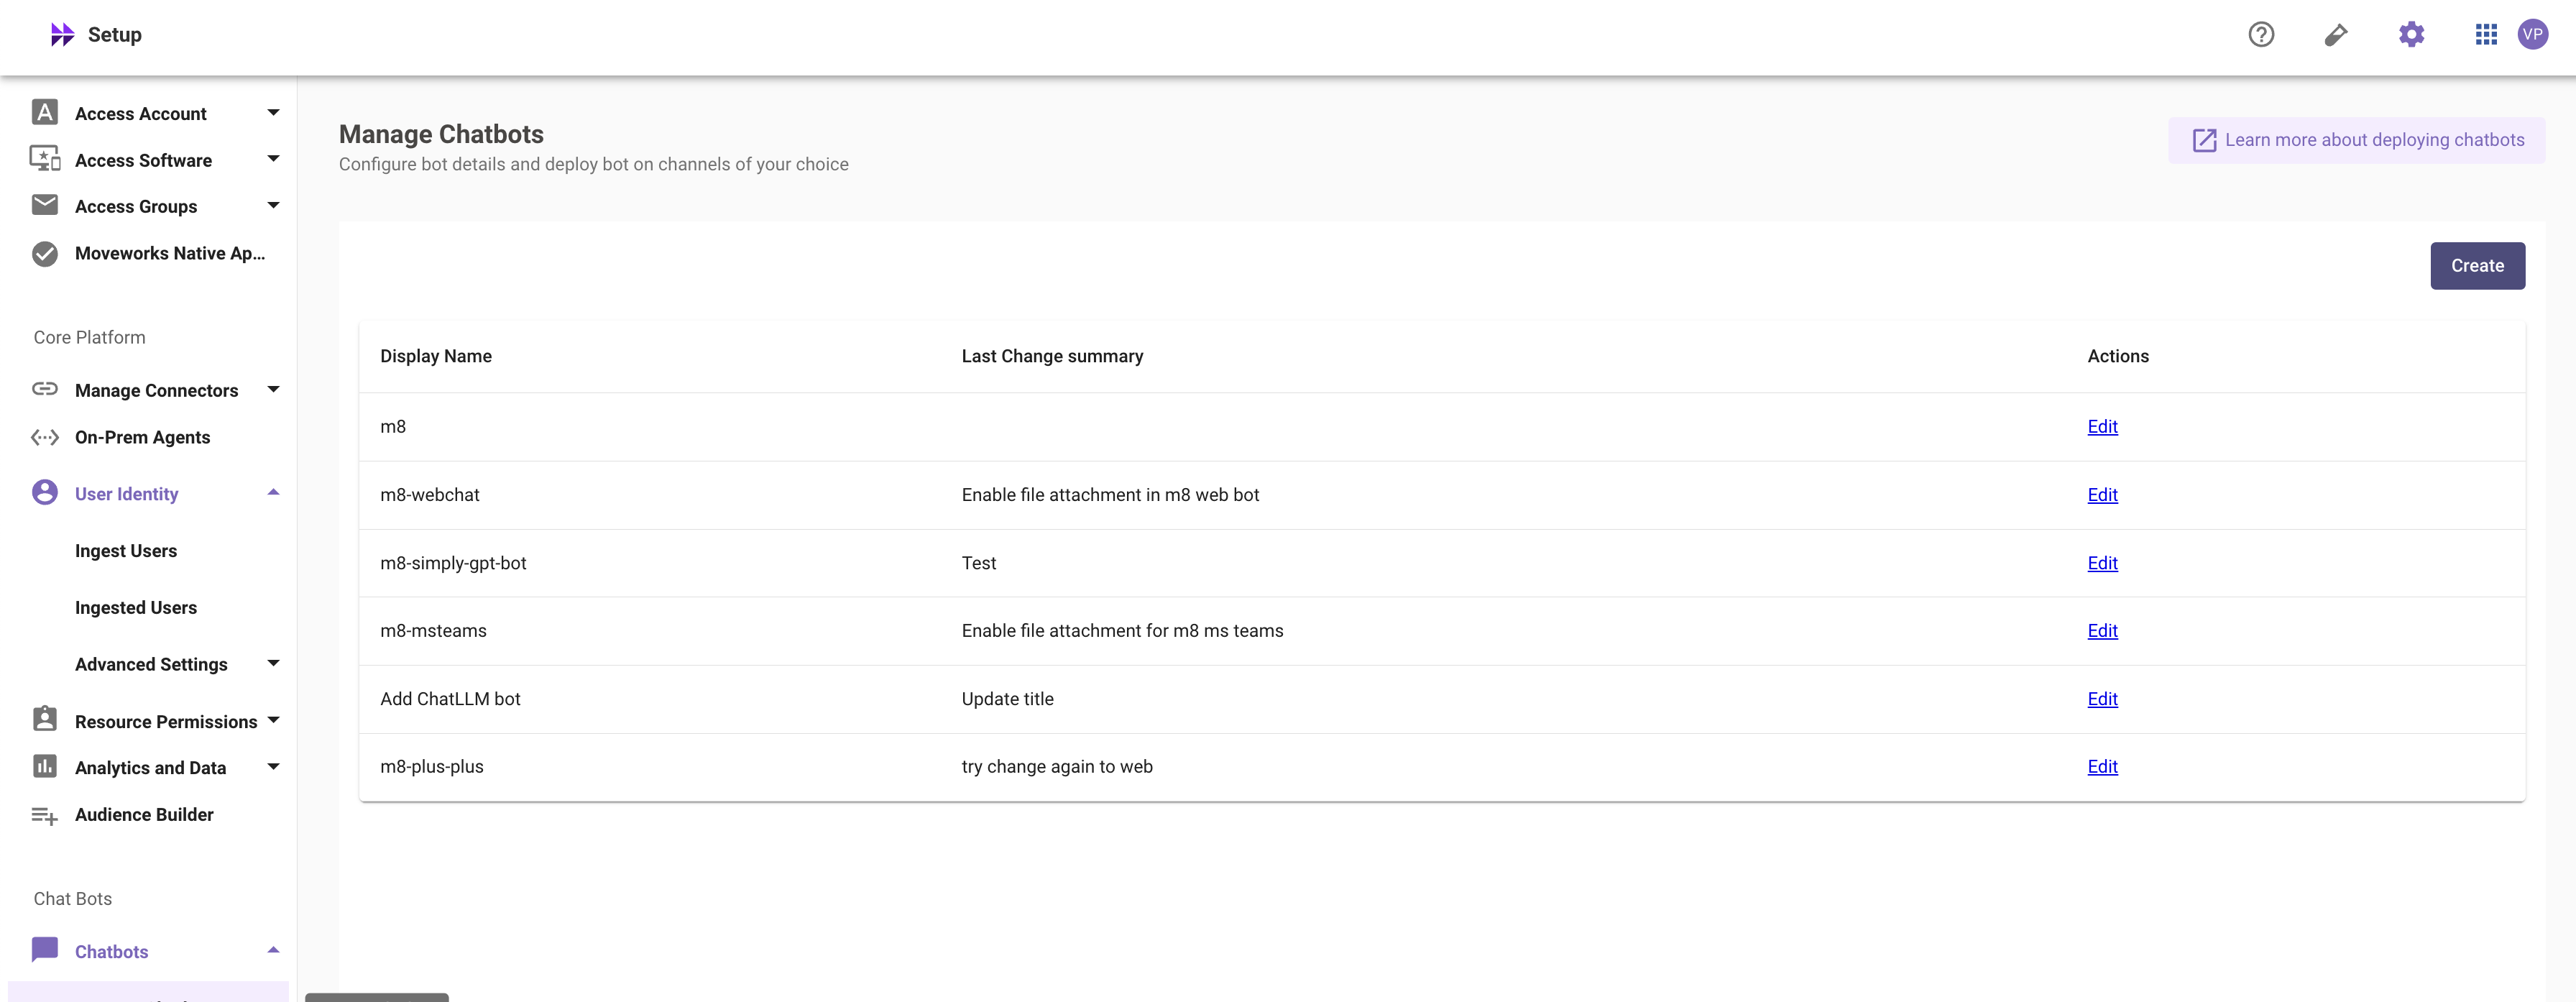
How do I see all platforms where AI Assistant is enabled ?
AI Assistant can be enabled in multiple chat platform or M4W. To understand details around each platform please visit the “Manage Chatbots” section in Moveworks Setup.
Please refer to this page to learn more on AI Assistant configuration.
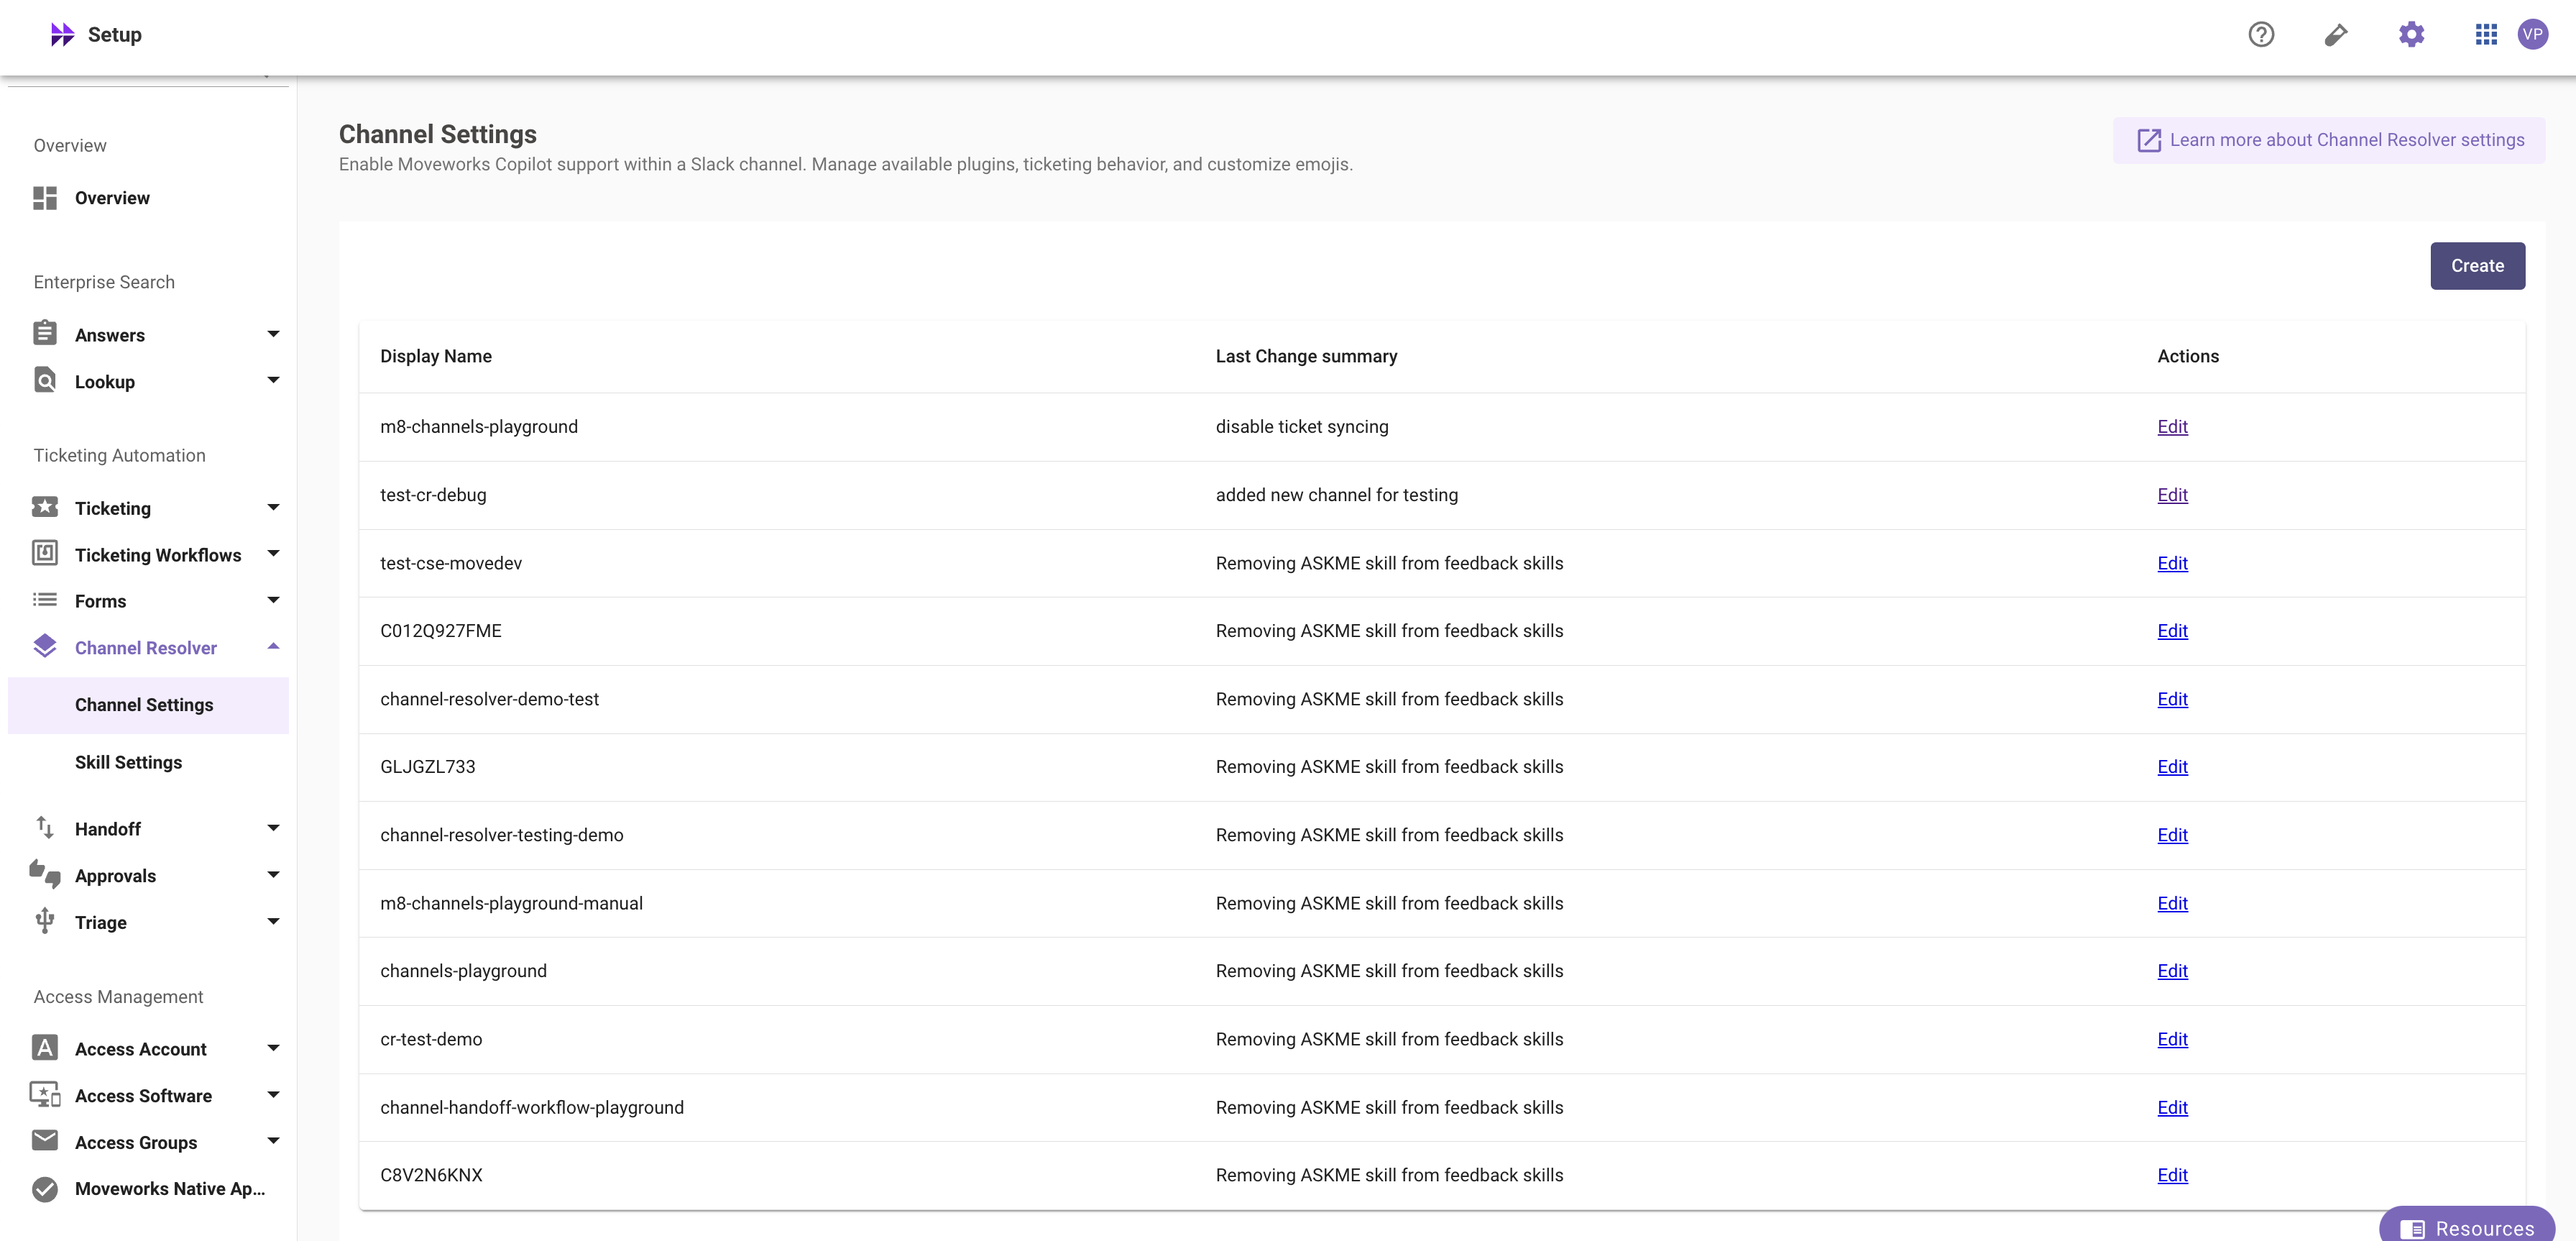
Slack channels are also counted as platform where user has interacted with the AI Assistant. All channels where Channel resolver is configured can be found under “Channel resolver” tab in Moveworks Setup. All of the se channels are counted as a single surface in the widget.
How do I see all languages supported in AI Assistant & enable more languages ?
The languages are controlled by MLS configuration. If the language is enabled in MLS configuration, AI Assistant will be able to use that language and allow user to switch the preferred language to the enabled language.
Please refer to this page to learn more on MLS configuration.
Troubleshooting and FAQ’s
What is the data refresh policy on this report?
AI Assistant conversation data is processed on a daily basis and is updated by 4:00 PM (PT) every day for the previous day's data. The demographic data, such as user department and location, is fetched from the user identity ingestion process, which runs approximately every 4 to 6 hours (Please note: The schedule for the identity ingestion pipeline can be configured differently for your organization)."
Why this report is not visible to few users?
Please ensure the user has the “Bot analytics admin” or “Bot analytics viewer” role to access the report. You can provide user the required role using the RBAC tool.
Why the report is taking too much time to load ?
The latency for the report is dependent on the selected time interval. If you see longer load times and failure in loading report please reachout to the moveworks support team.
Updated about 1 month ago