Apps & Services
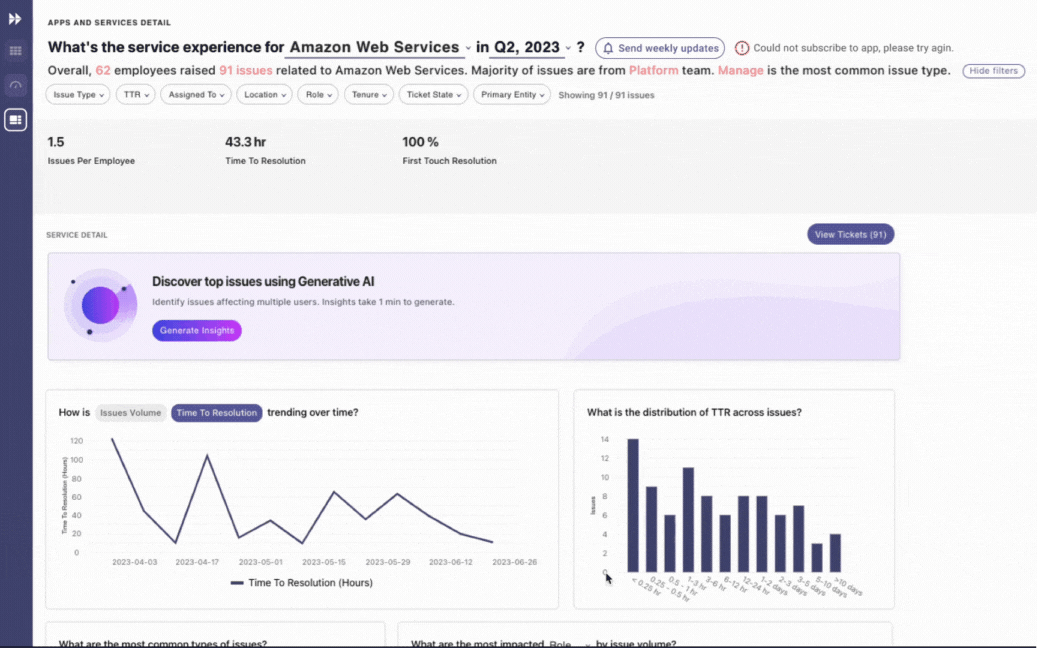
EXI’s Apps & Services feature enables users to measure the service experience for any application or service, such as Zoom, Wi-Fi, Networking, and VDI, among others. Users can see high-level trends in issue volume, time to resolution (TTR), and the distribution of TTR.
And, because it uses NLU to detect apps in your org, you don’t need a clear configuration item database setup.
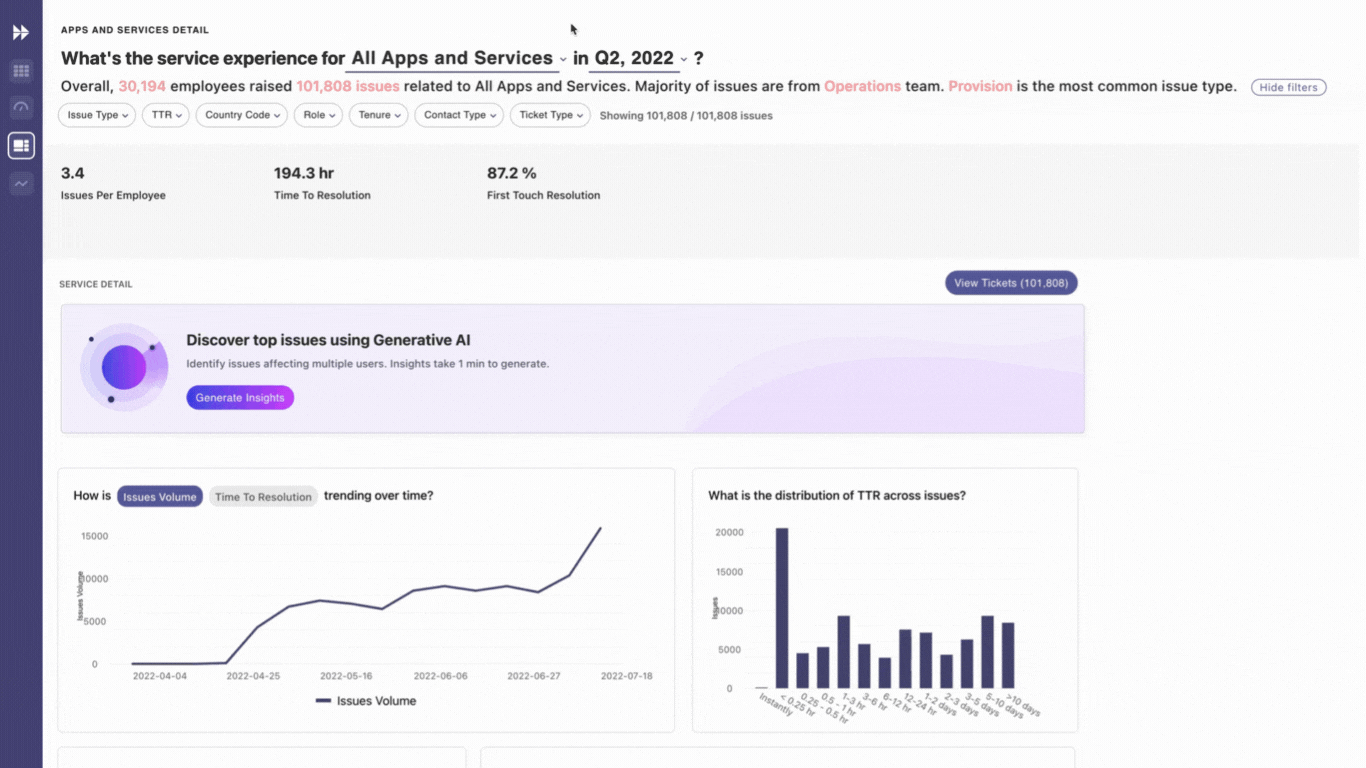
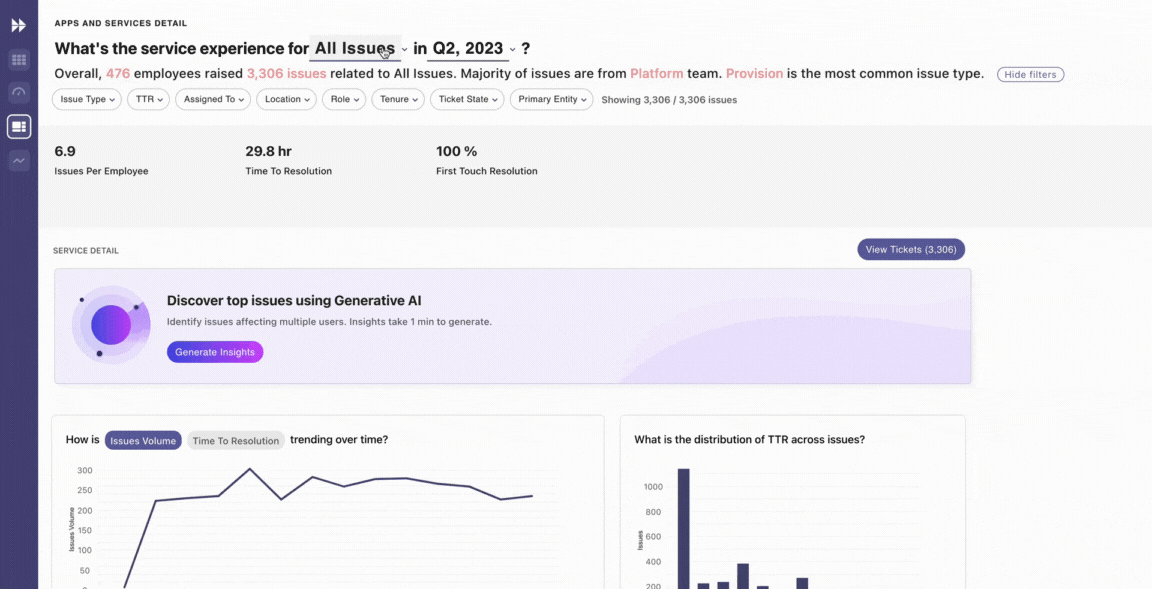
You can filter the service experience insights by two primary attributes: entities and time period. The date filters are in relation to the created timestamp of the tickets, so filtering for June 2023 will show all tickets created in June 2023, not all tickets resolved.
From there, you can further refine filtering with configured filters. Some examples are: Issue Type, TTR, Country Code, Role, Tenure, Contact Type, and Ticket Type.
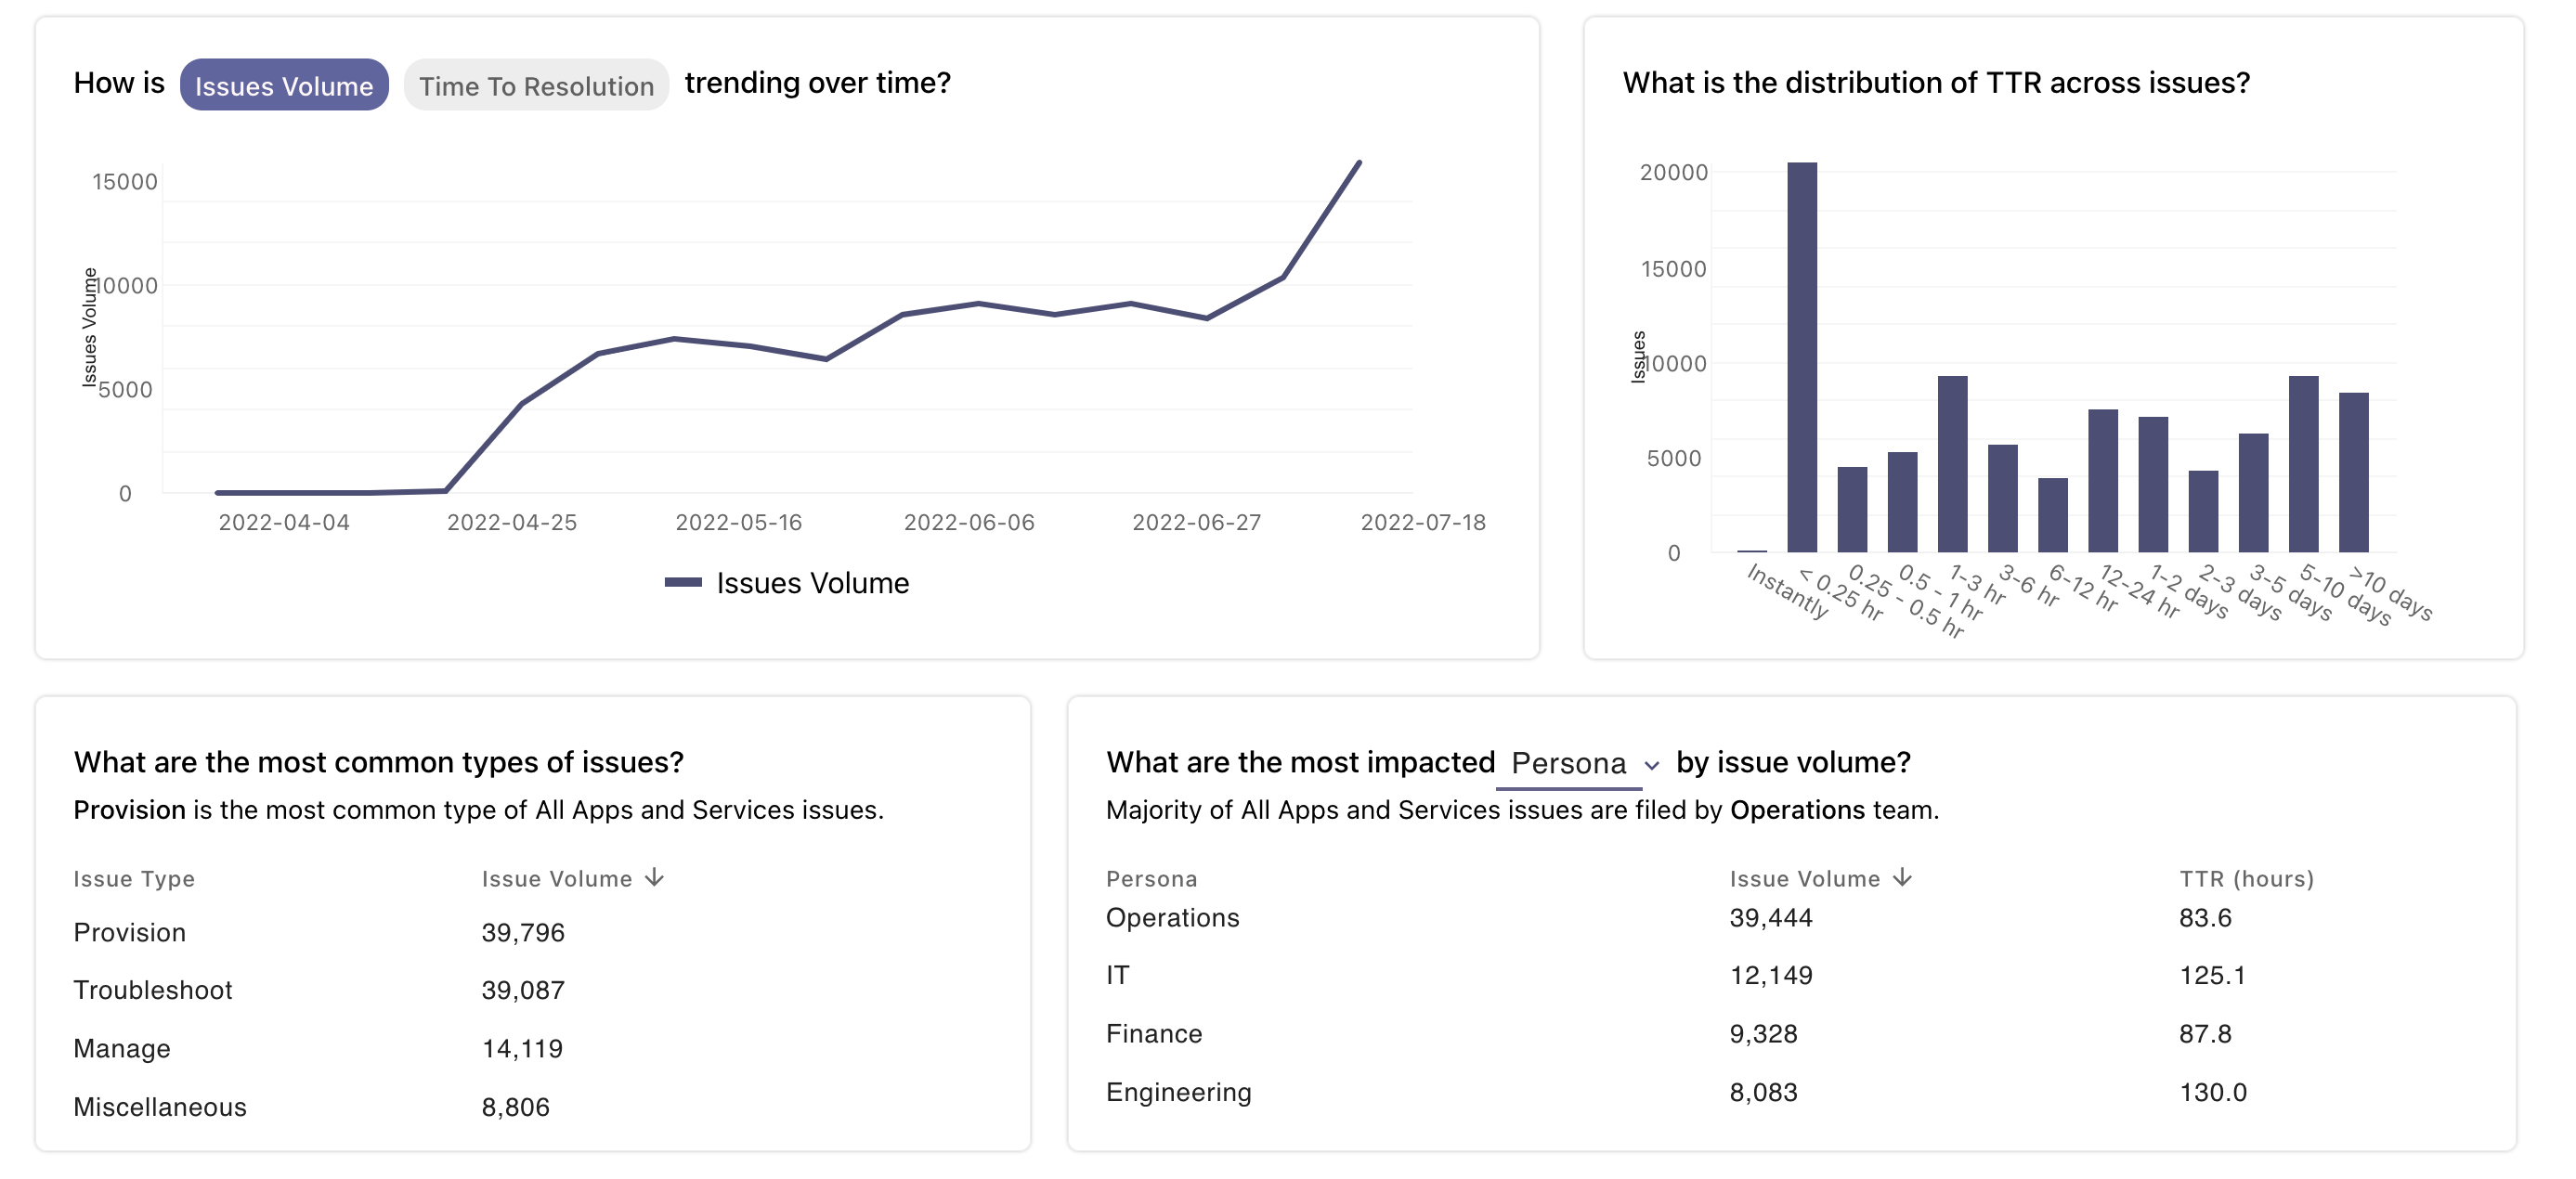
You can also view how these issues are doing over time with the graphs above.
AI Summary
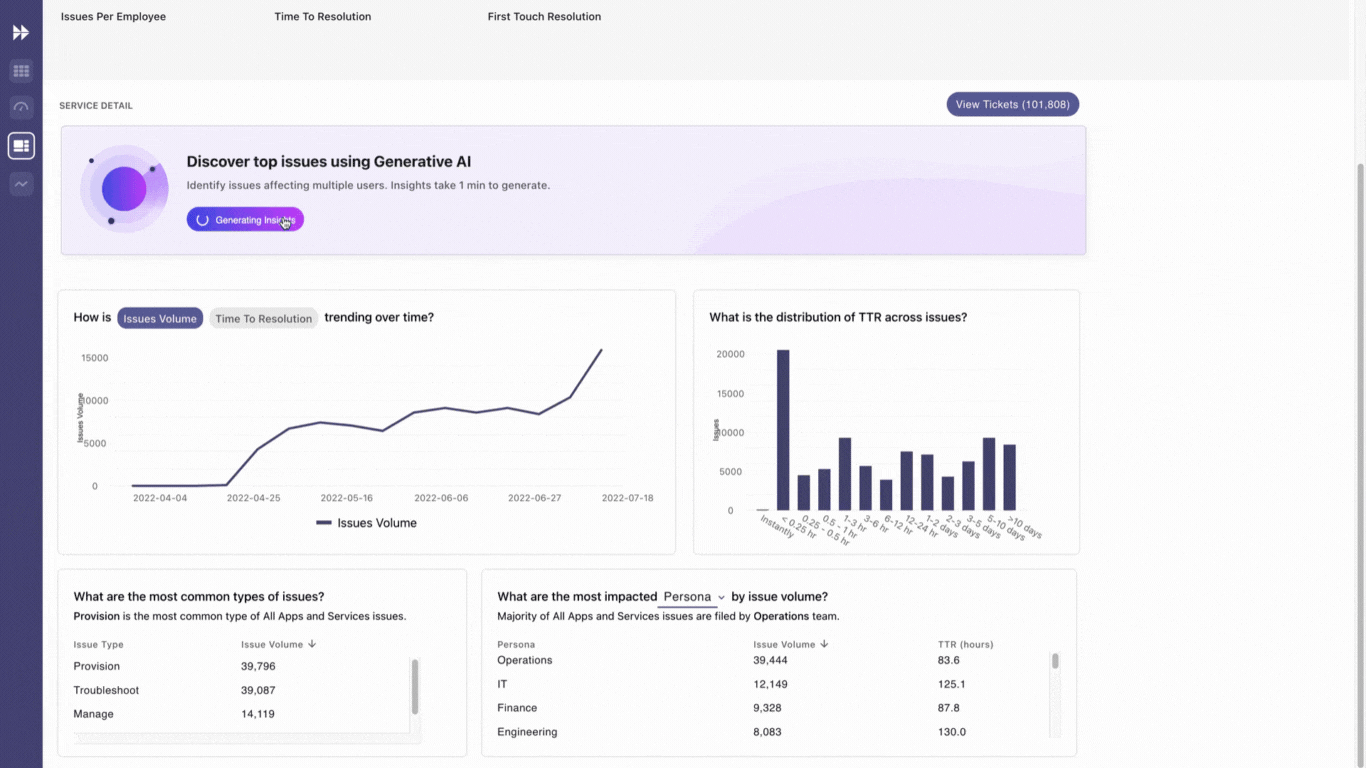
EXI’s AI Summary feature identifies key themes or topics within a select group of tickets by clustering and summarizing them using large language models (LLMs). EXI can automatically analyze tickets using LLMs and highlight the most important topics for users to focus on within an Intent-Entity category or a chosen application or service.
For each topic, users can:
- View impact metrics such as the number of tickets, number of employees impacted, issues per employee and time to resolution.
- View all tickets corresponding to a particular topic in the side panel.
- Export tickets for any topic using the side panel.
How do I access AI Summary?
To access EXI’s AI Summary feature, navigate to the Apps & Services module in EXI. Next, pick an application and apply the required filters. Lastly, click on the Generate Insights button.
App Digests
EXI’s App Digests feature allows you to follow any individual application in your organization. By following an application you will receive updates on the application with information on gradual trends or sudden spikes. EXIs AI automatically detects any anomalous activity and will notify you at the beginning of each week.
How to follow an application
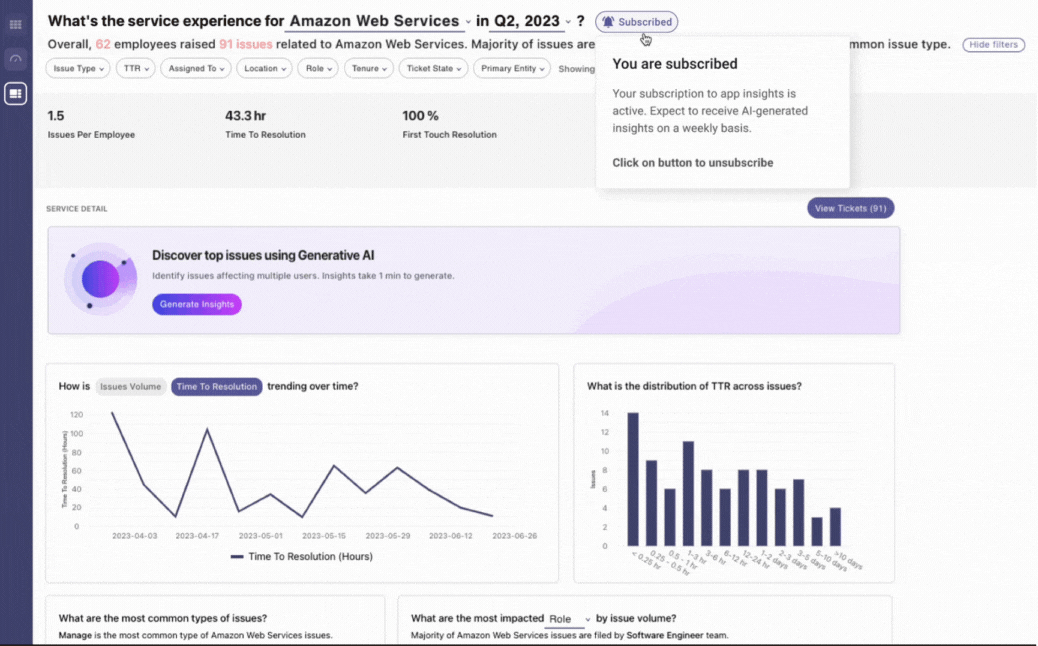
- First, go to the Apps & Services page. “All apps & services” is selected by default.
Note: When “All apps & services” is selected, the Subscription button will not be available.You will need to follow steps 2-3 to select a specific application to subscribe to insights.
- Click on All Issues to open the dropdown and select the application you’d like to follow.
- Then, click on Get Weekly Insights to subscribe to notifications from this application.
In-chat bot notifications with insights
The bot notification with app insights will resemble the image below:
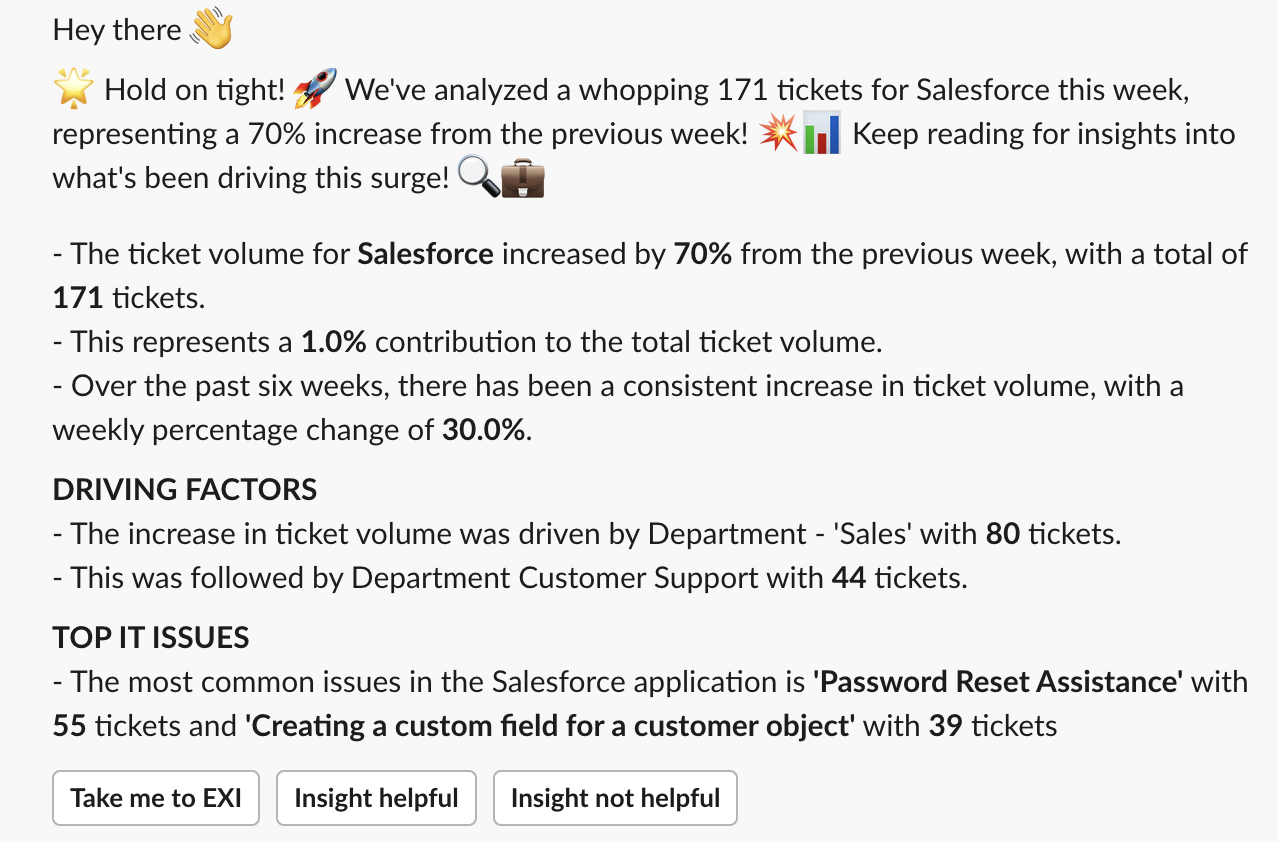
These notifications are not customizable. Once subscribed, the notifications will be sent on Monday at 10 AM ET, only via Slack/Teams Moveworks Assistant.
How to unfollow an application
-
To stop receiving notifications about an application, click on the Subscribed button with the bell icon. The bot will now stop sending notifications with insights on the application.
Updated 4 months ago