Data API : Integration requirements and capablities
Overview
The Data API is a set of OData APIs that enable the export of raw analytics data. It provides five different APIs, each delivering data in a normalized format.
This document outlines the key requirements for building an integration with the Data API and highlights the use cases it can help address.
Pre-requisites
The Data API provides a daily stream of raw analytics data. To get the most value from this data and track custom metrics effectively, there are three essential components you’ll need to set up:
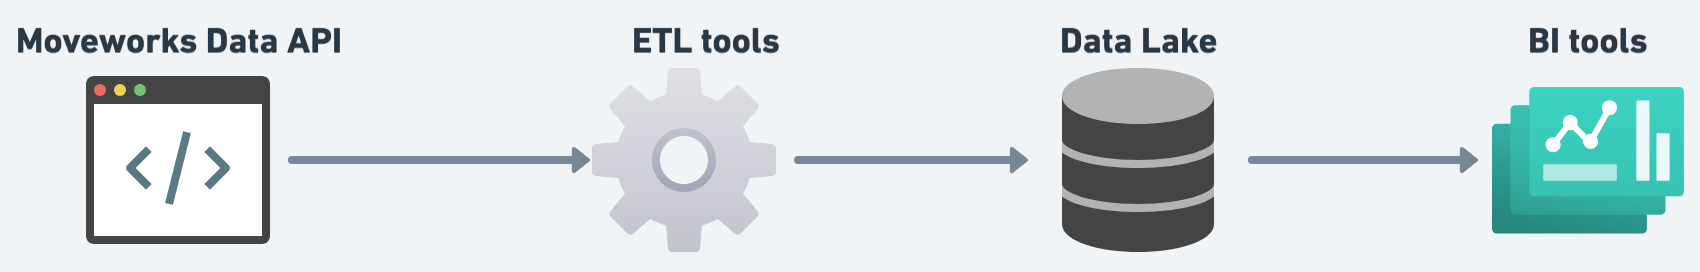
Data Lake A data lake is like a central storage system for all your analytics data. It keeps everything in one place—no matter the format—so you can scale easily as your data grows. Having a data lake ensures your data is always ready to connect with automation pipelines and BI tools for reporting.
ETL Pipelines (Automation Tools) ETL tools automatically move and prepare data so you don’t have to. They extract data from the API, clean and organize it, and then load it into your data lake. Whether you use a simple script or automation platforms like Workato or Power Automate, ETL pipelines save time, reduce errors, and make sure your data is always up to date.
BI Tools A Business Intelligence (BI) tool brings your data to life. Instead of looking at raw tables or spreadsheets, BI tools let you create interactive dashboards and reports. This makes it easy to spot trends, share insights, and make informed decisions across your organization.
To understand how these different tools interact with each other you can refer to the following diagram.
What can be achieved via Data API?
The Data API provides raw analytics data that enables you to build custom dashboards in your own environment. The capabilities of your dashboard can extend the capabilities provided by the Moveworks AI Assistant insights product.
What type of dashboard can i build?
There are multiple themes of dashboard that you can build using Data API. The following themes present few examples of what can be build using Data API.
1. Engagement & Volume Analytics
Dashboards you can build
- Conversation volume trends over time
- Channel adoption (Slack, Teams, Web, etc.)
- Escalation vs. automation rates
Raw data powering it
/conversations→ timestamps, conversation IDs, escalation flags/interactions→ user/assistant turns, channel metadata
2. Assistant Behavior & Containment
Dashboards you can build
- Resolution/deflection dashboards
- Conversation analysis (where conversations start, how they evolve)
Raw data powering it
/interactions→ detailed turn-level data (utterances, outcome, type of turn)/conversations→ conversation lifecycle context
3. Plugin Adoption & Performance
Dashboards you can build
- Plugin usage based on the user queries
- Execution success vs. failure rates (Unsuccessful v/s served v/s used)
- Plugin latency and reliability over time
Raw data powering it
/plugin-calls→ plugin name, timestamps, execution status, response times/interactions→ user messages and ai assistant performance
4. Knowledge & Content Effectiveness
Dashboards you can build
- Most frequently cited knowledge articles
- Content coverage by domain or function
- Identification of gaps where knowledge is missing
Raw data powering it
/plugin-resources→ resources cited (knowledge items, external docs)/plugin-calls→ plugin runs tied to knowledge usage
5. Organizational Adoption & Rollouts
Dashboards you can build
- Adoption by department, location, or role
- Comparison of automation coverage across org units
- User-level engagement metrics
Raw data powering it
/users→ user external system IDs (Fetch department, location data from your primary system)- Joined with
/conversationsand/interactions
6. End-to-End Interaction Journey (Raw Interactions View)
Dashboards you can build
- A unified journey table showing conversations + turns + plugin activity + cited resources
- Advanced KPIs like Mean Time to Resolution (MTTR), deflection %, and coverage
- Custom operational dashboards for support teams
Raw data powering it
/conversations+/interactions+/plugin-calls+/plugin-resources(joined together)
What are the different steps involved in building the integration?
This guide outlines the steps required to build a complete integration with the Moveworks Data API and establish your analytics pipeline.
Integration Process
The integration process consists of three main phases:
Phase 1: Define Analytics Requirements
Before implementing your integration, establish clear analytics goals with your stakeholders.
Goal Definition
Determine your primary objectives:
- Recreate existing metrics: Mirror metrics available in Moveworks internal dashboards
- Build custom metrics: Develop new metrics not currently captured in Moveworks analytics
Metric Planning
- Collaborate with internal stakeholders to identify required metrics
- Document specific KPIs and reporting needs
- Reference the common metrics guide for standard use cases
- Consult the Metrics Library for calculation methodologies
Phase 2: Implement Data Pipeline
Select Data Storage Solution
Choose a database that supports your analytics requirements. We have used Snowflake as it provides:
- Native API connectivity through connectors and SDKs
- Scalability for large data volumes
- Integration with popular automation tools
Note: The Data API returns raw data that requires storage and transformation for meaningful reporting.
Choose Automation Tool
Select an automation tool that can:
- Handle API failure scenarios gracefully
- Implement rate limiting logic
- Support scheduled data ingestion
- Provide error logging and monitoring
Reference our Python integration guide for implementation examples.
Identify the correct API URL for your environment
| Region | Base API URI |
|---|---|
| US PROD | https://api.moveworks.ai/export/v1/records |
| EU PROD | https://api.am-eu-central.moveworks.ai/export/v1/records |
| CA PROD | https://api.am-ca-central.moveworks.ai/export/v1/records |
| GOV cloud PROD | https://api.moveworksgov.ai/export/v1/record |
Data Ingestion Strategy
The Data API provides historical data from August 2024 onwards. Your ingestion strategy should include:
Initial Historical Backfill
- Generate API credentials through the Setup application
- Define your historical data start date
- Implement pagination to retrieve all historical records
- Store data in your selected database
Ongoing Daily Ingestion
Establish a daily synchronization process using the last_updated_time field:
- Query for records updated since the last sync. To find out the SLA refer to this doc.
- Process new and updated records. You should use the upsert functionality in your database to update a existing record or create a new record. The
idfield in each table is immutable and should be used to perform the Upsert action. - Log sync status for monitoring
API Best Practices
Important: The Data API follows the OData protocol. Always use the
$orderbyparameter in your queries to ensure consistent pagination and prevent duplicate records.
Example Query:
https://api.moveworks.ai/export/v1beta2/records/conversations?$filter=last_updated_time ge '2024-01-01T00:00:00Z'&$orderby=idQuery Parameters:
$filter: Apply time-based or field-based filters$orderby: Ensure consistent record ordering$top: Control page size (default: 1000)$skip: Navigate through pages
Phase 3: Build Analytics and Reporting
Tool Selection
Choose a business intelligence tool that:
- Connects to your selected database
- Supports complex SQL queries and joins
- Provides visualization capabilities
- Enables scheduled report generation
Popular options include:
- PowerBI
- Tableau
- Looker
- Qlik Sense
Team Requirements
Ensure your team includes resources with:
- SQL expertise for data transformation
- Experience with your chosen BI tool
- Understanding of the Moveworks data model
- Knowledge of your organization's reporting requirements
Report Development
-
Data Modeling
- Create SQL views joining relevant tables
- Build aggregation tables for common metrics
- Implement data quality checks
-
Metric Implementation
- Reference the Metrics Library for calculation logic
- Validate metrics against expected values
- Document calculation methodologies
-
Dashboard Creation
- Design dashboards aligned with stakeholder needs
- Implement drill-down capabilities
- Schedule automated report distribution
Data Model Reference
Table Relationships
Conversations (1) → (Many) Interactions
Interactions (1) → (Many) Plugin Calls
Plugin Calls (1) → (Many) Plugin Resources
Users (Standalone reference table)
Key Join Fields
conversation_id: Links interactions, plugin calls, and resources to conversationsinteraction_id: Links plugin calls to specific interactionsplugin_call_id: Links resources to plugin callsuser_id: References user information across all tables
Updated 16 days ago