
Triage Insights
Overview
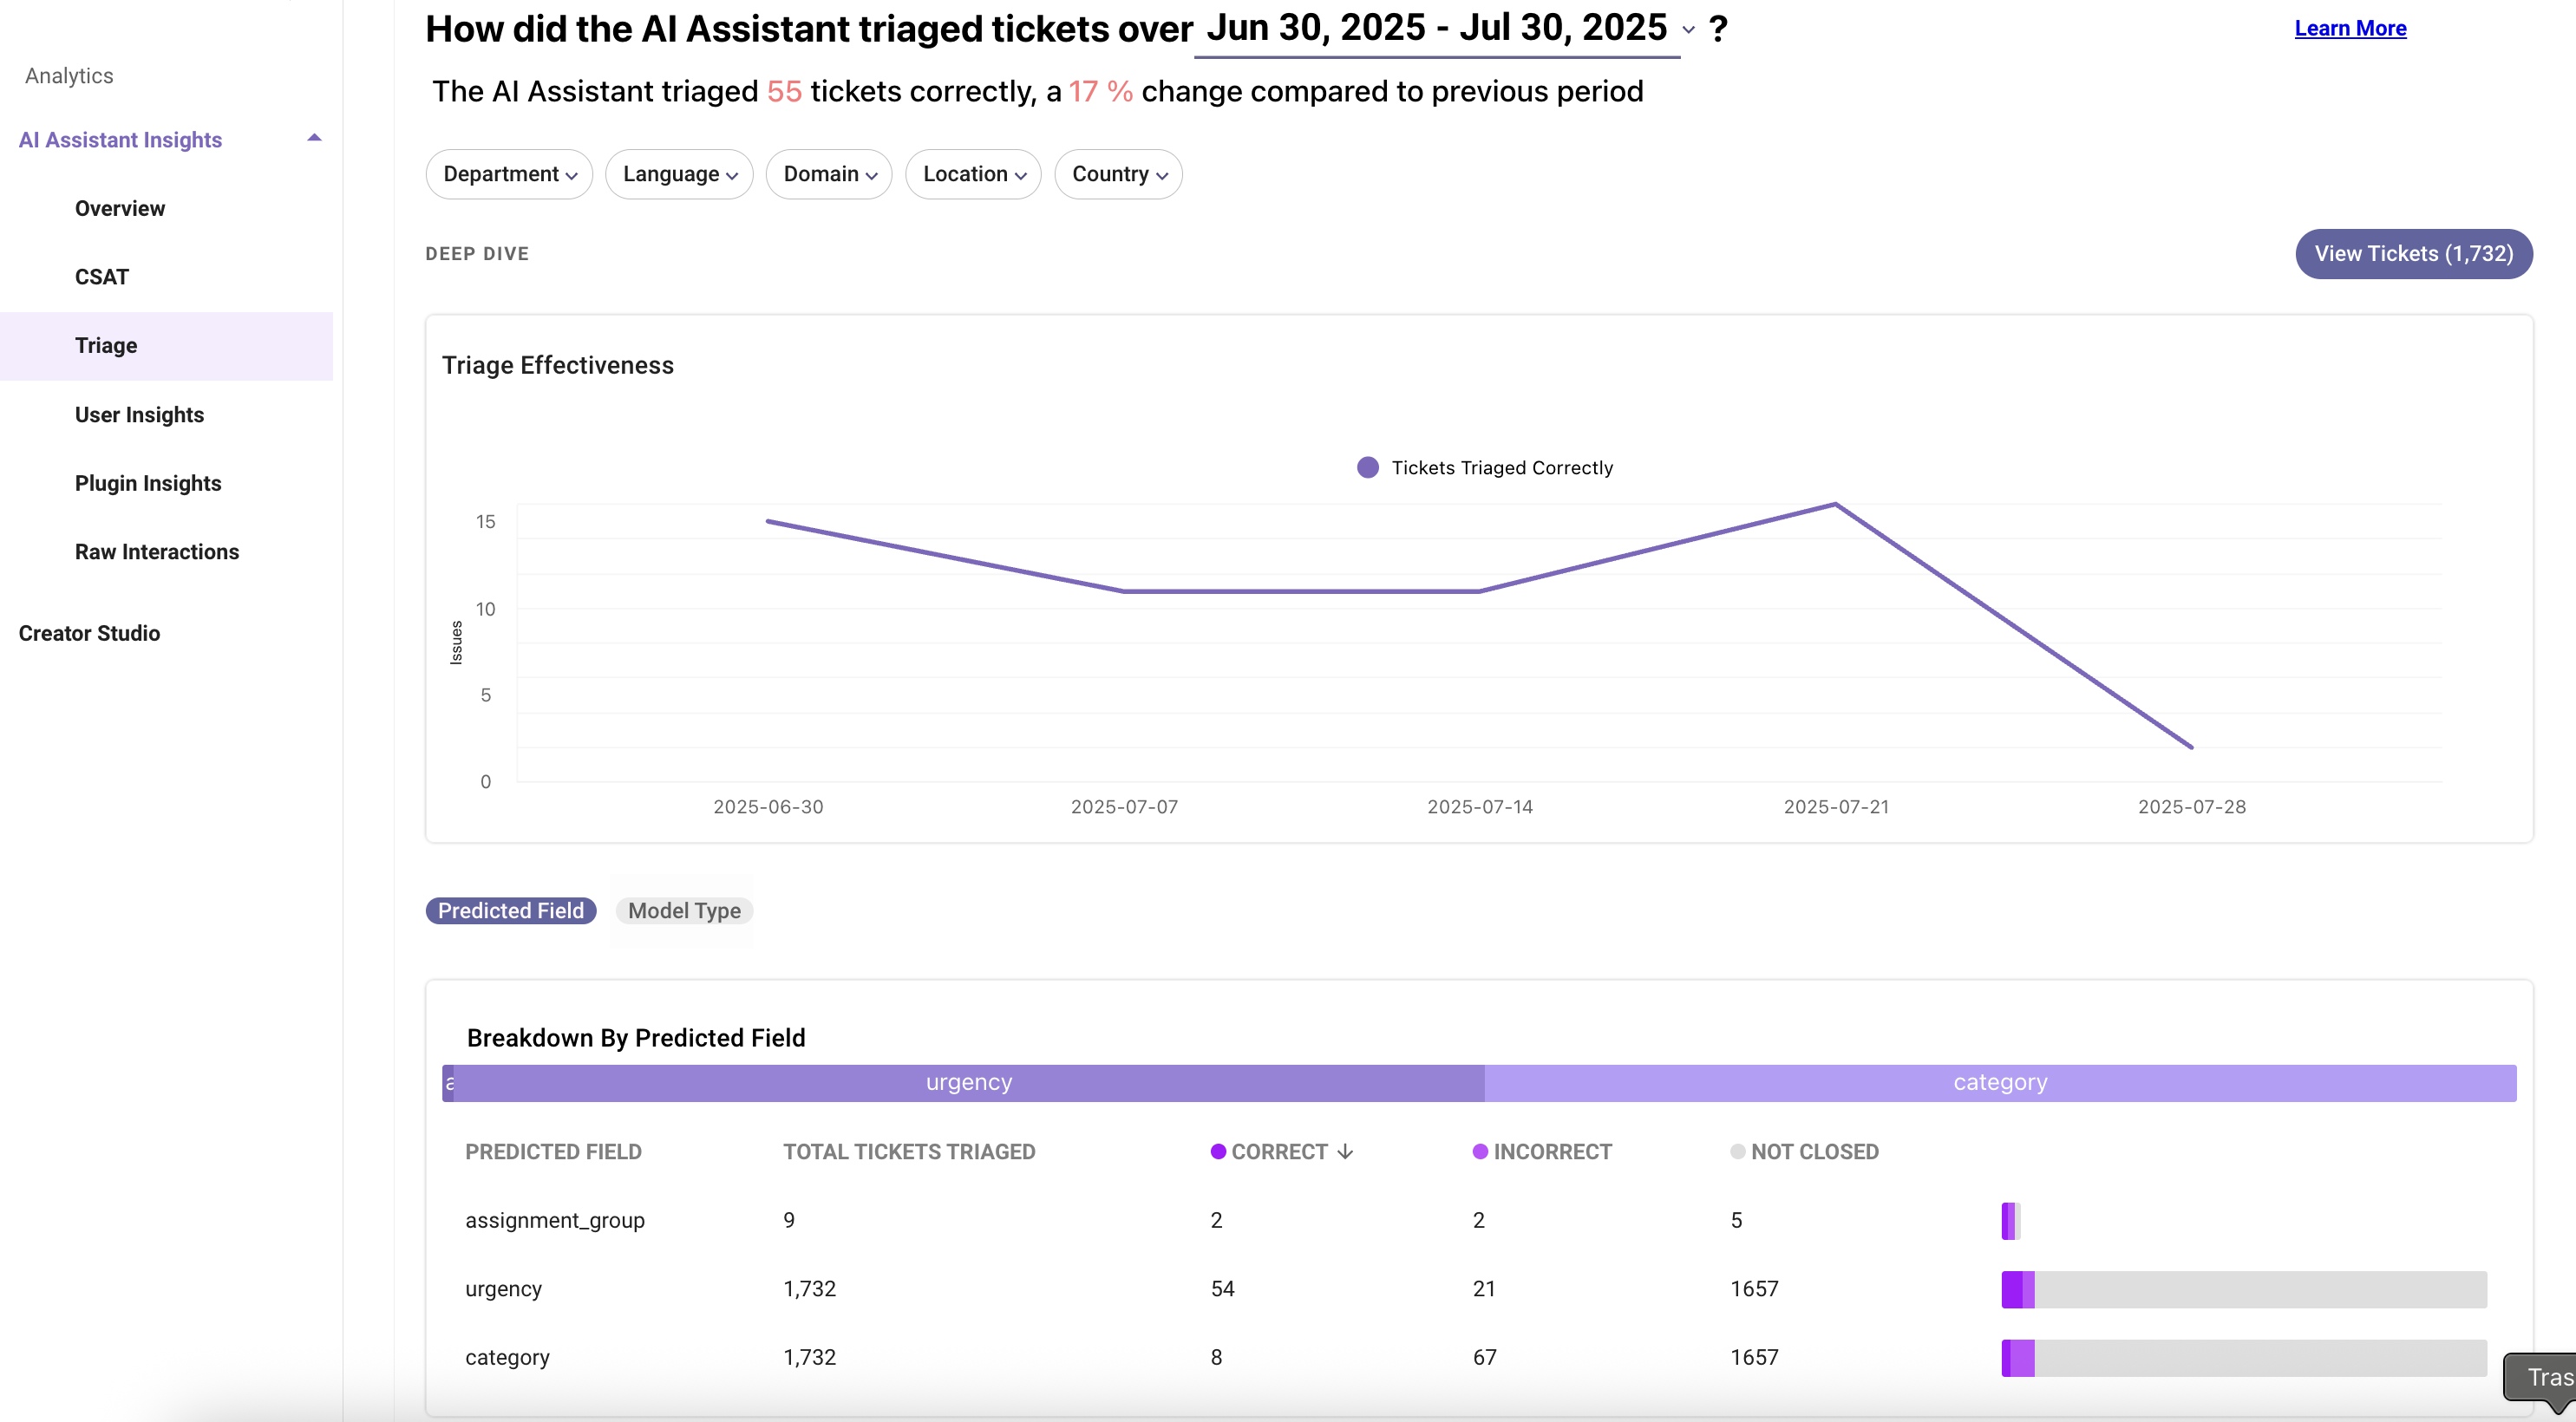
The Triage Insights dashboard is available to all customers with access to AI Assistant Insights. You can access this dashboard by clicking the Triage tab in the analytics application on the navigation sidebar. This view provides an overview of the Triage Effectiveness and Breakdown by Predicted Field and Model Type.
Key terms used in the table
Below the chart, there is a table that aggregates triage performance using the following terms (in the columns):
| Key terms | Definition |
|---|---|
| Predicted Field | The full set of configured triage models, in which the names, e.g. assignment_group, urgency, etc are specified by the admin within Moveworks Setup. |
| Model Type | The full set of model types, in which the label either Routed (moves a ticket to a specific agent queue) or Categorized (labels a ticket for analytical purposes) is specified by the admin within Moveworks Setup. If the model prediction = the final value, then it's labeled as No Change. |
| Total Tickets Triaged | The # of tickets with a prediction within the specified time, regardless of their closed or resolved status. |
| Correct | The # of tickets in which the final ticket field value equals the predicted value. |
| Incorrect | The # of tickets in which the the final ticket field value differs from the predicted value. |
| Not Closed | The # of tickets that are still open, e.g. not in state Resolved or Closed , which means they are unable to be evaluated for correctness, e.g. "correct" or "incorrect." |
| Triage Result Type | This can be one of 3 values - Correct, Incorrect, or No Final Label. No Final Label is equal to Not Closed. |
Filters and widget types
The Triage Insights Report allows you to filter for a selected time period, department, location, country and language on the ticket.
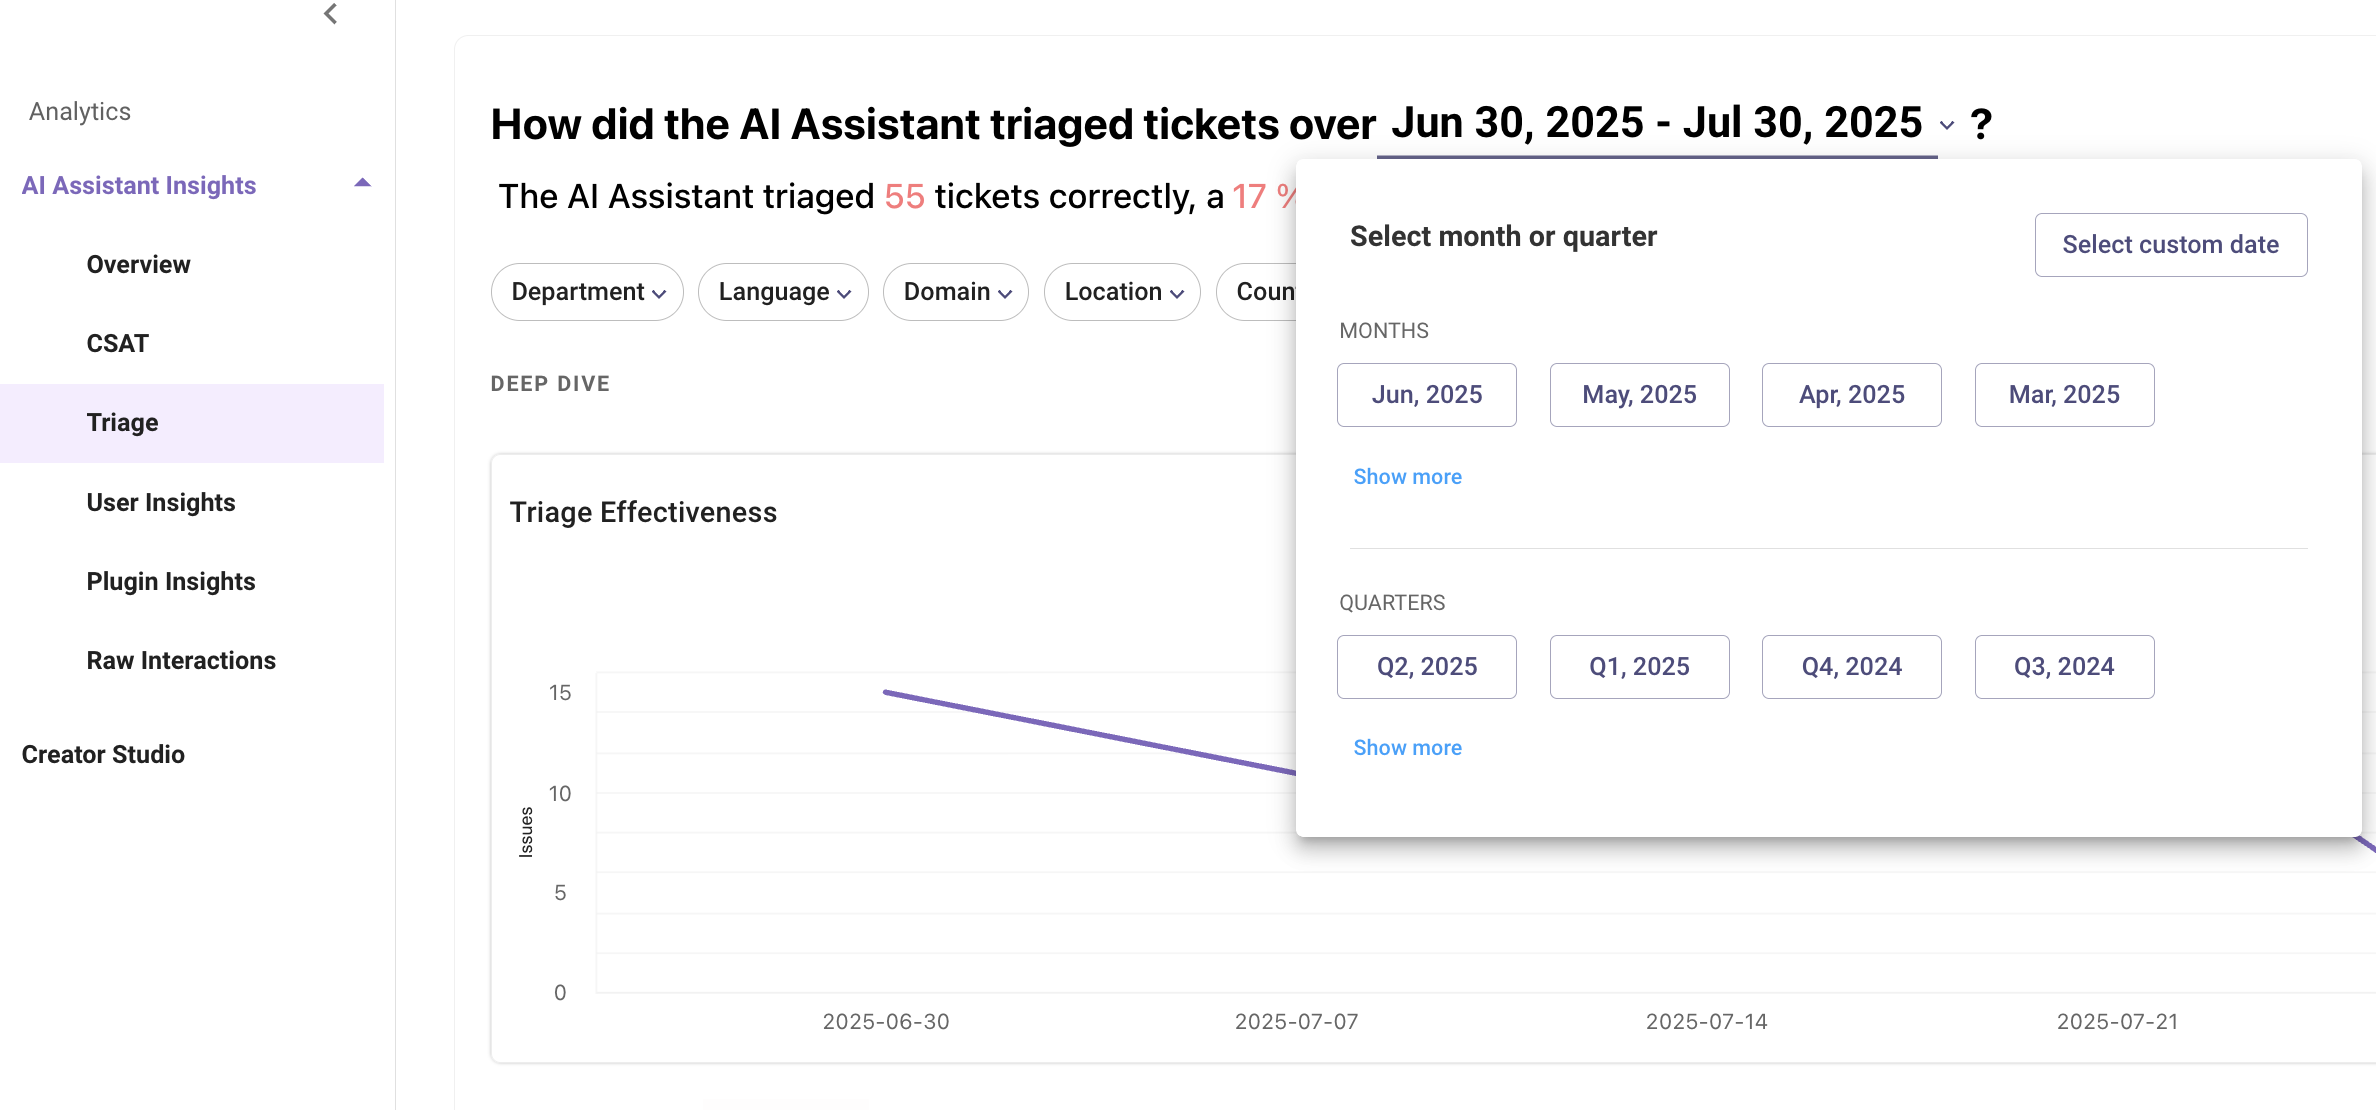
Select date interval for which you want to review the served content details
By default the dashboard shows approval plugin performance for previous 30 days. This can be changed using the date interval selection. You can select previous months (or) quarters using the selection available in the dropdown.
The dashboard also allows custom date interval selection. You can access that using the “select custom date” button.
🗒️Please note, if you are choosing custom dates, the report data will be projected up to one day before the chosen end date.
Select department/ location/ domain/ country/ language for which you want review the triaged tickets with that filter criteria
Triage insights report provides 5 top level filters which can used to filter the data.
The department/location/country value is ingested from your external system used in user identity, which is paired with each ticket. Please refer here to learn more on user identity ingestion.
Widget types used in this dashboard
- Trend chart
Line chart or Bar chart that presents the values of one or more metrics over a period of time, with selectable time intervals (day, week, month). For example: trend of active user over a selected time interval.
The day, week, month breakdown is only visible for a selected time interval.
| View type | Minimum time interval | Maximum time interval |
|---|---|---|
| Daily | 1 Day | 30 Days |
| Weekly | 2 Weeks | 26 Weeks |
| Monthly | 1 Month | 24 Months |
- Table
A tabular list of one or more dimensions and their metrics. Triage model performance is measured based on the model type.
Deep dive into widgets
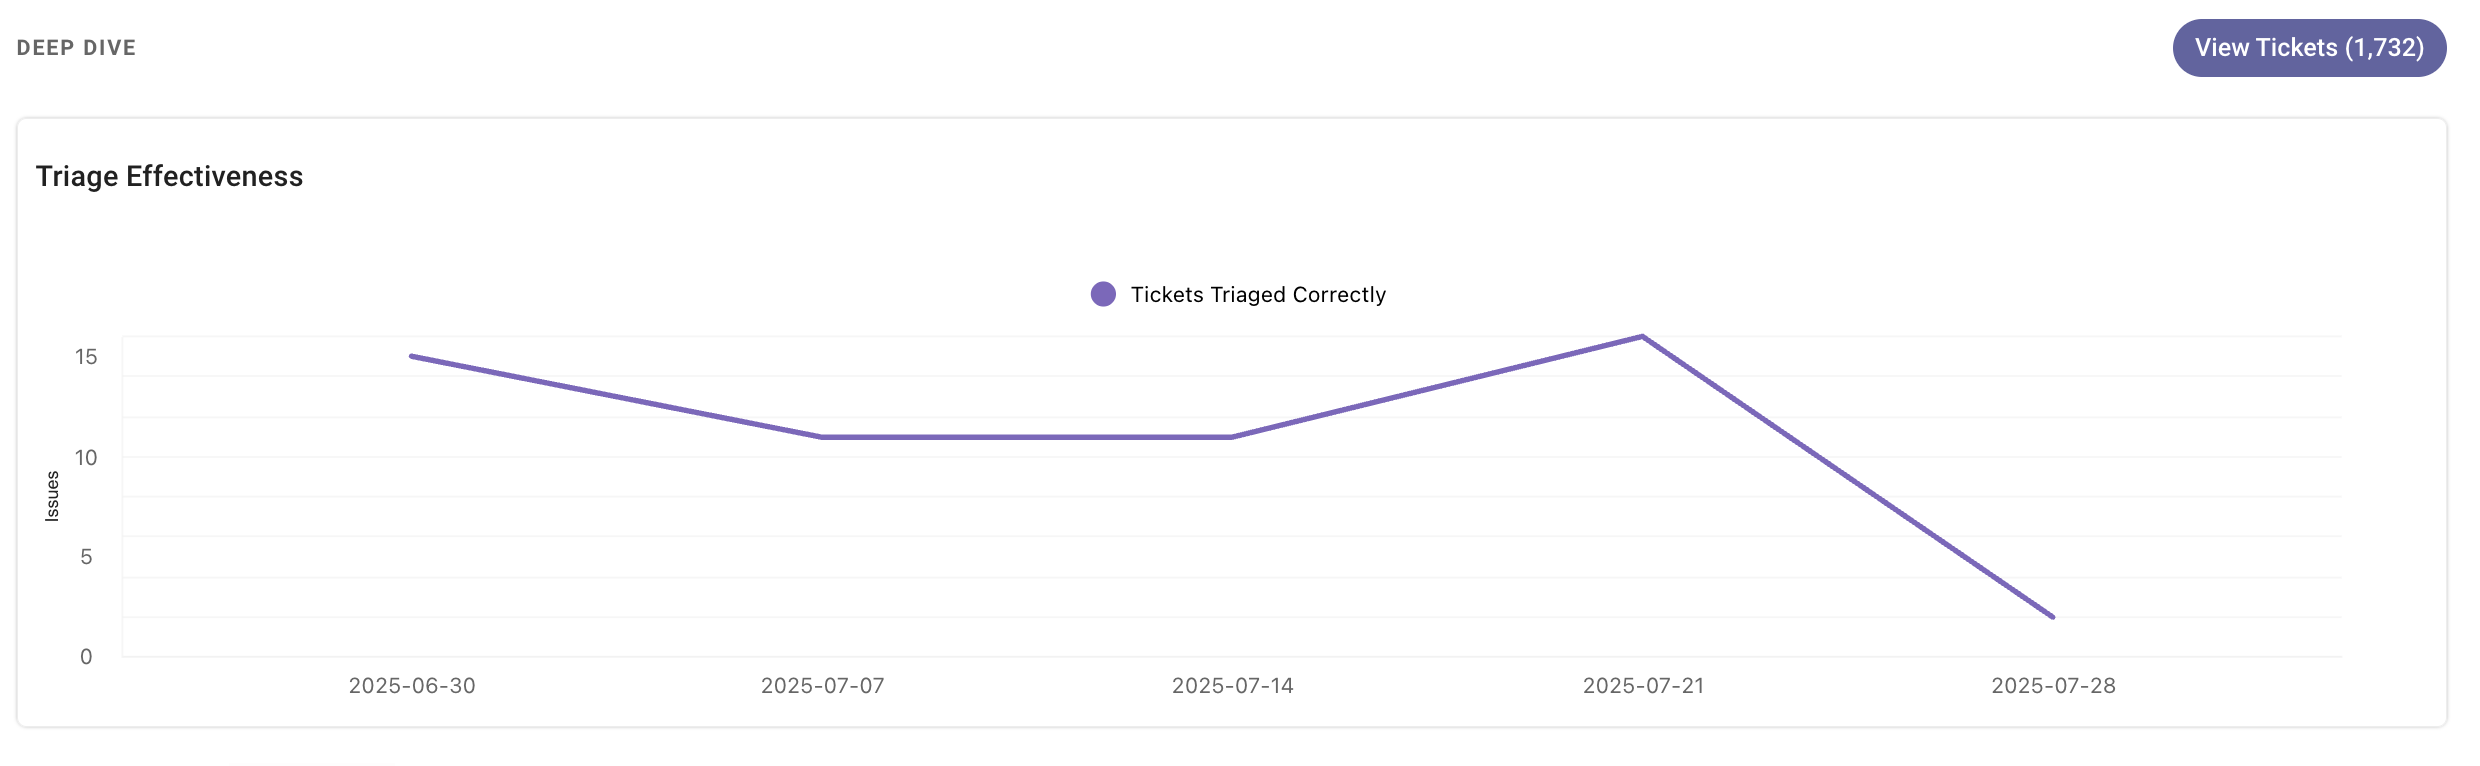
Trend of Triage Effectiveness
This widget gives the trend of tickets that were triaged correctly over a period of time.
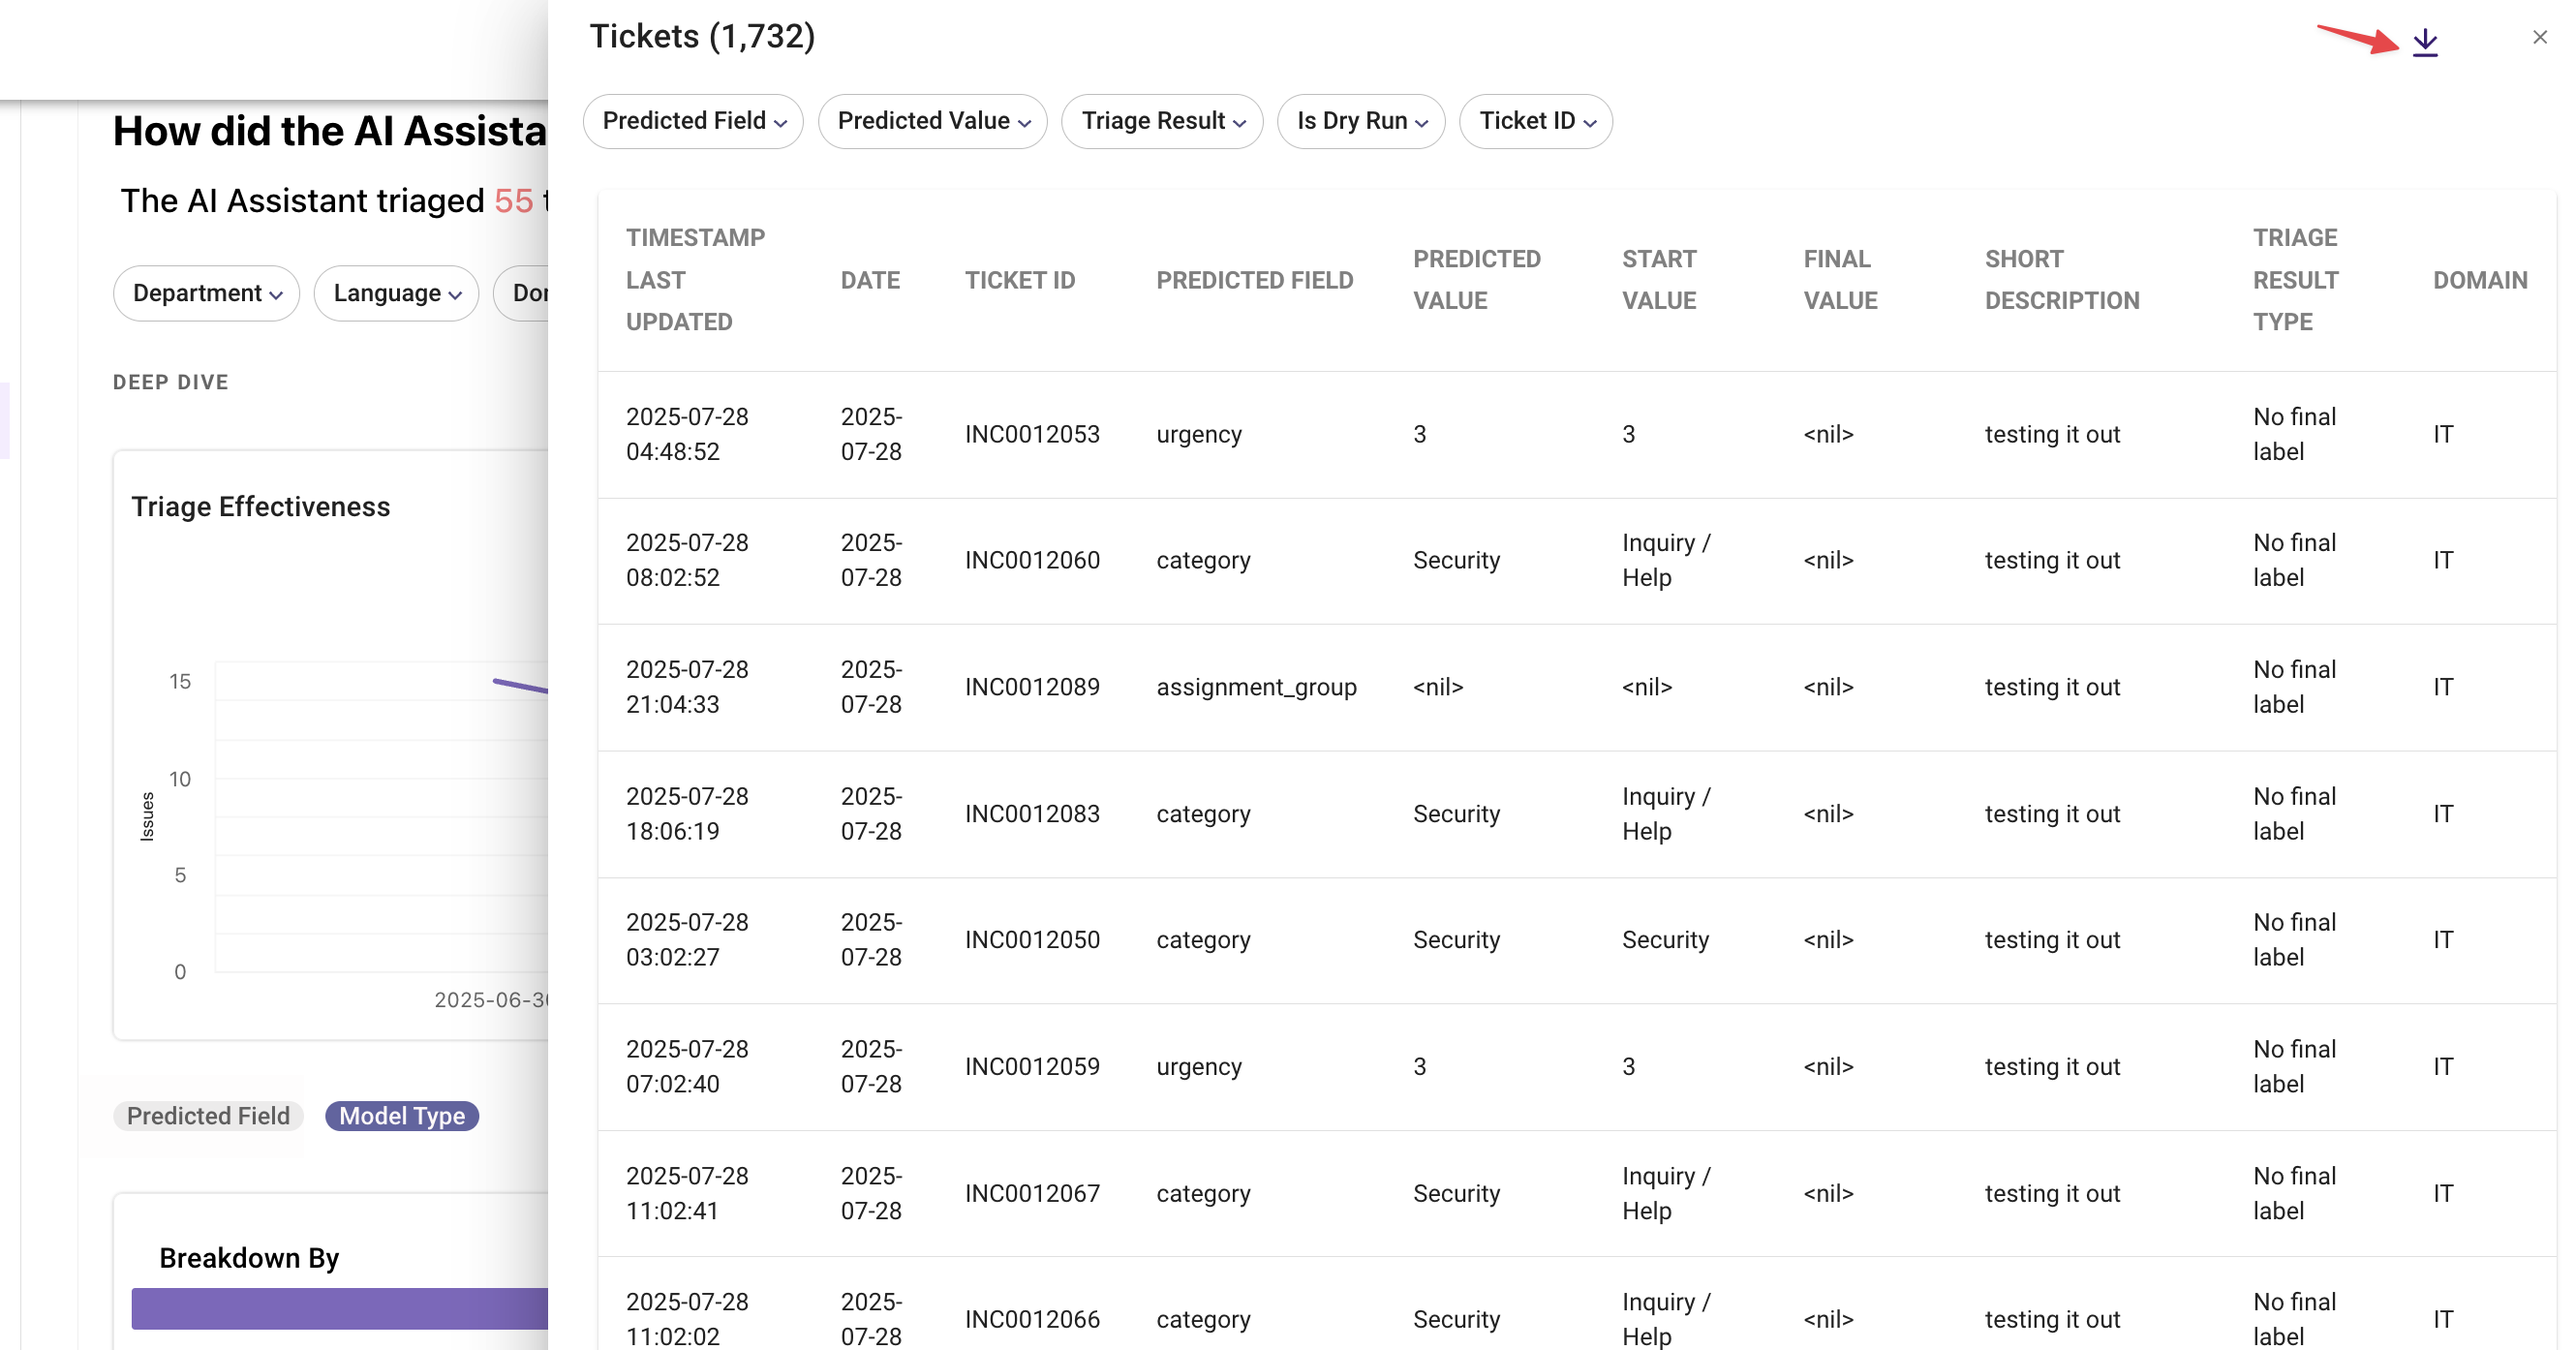
View Tickets
To view all tickets with predictions, you can click on View Tickets to see the table. The table contains all the tickets with predictions from all configured models. You can click the download icon to get a copy on your computer.
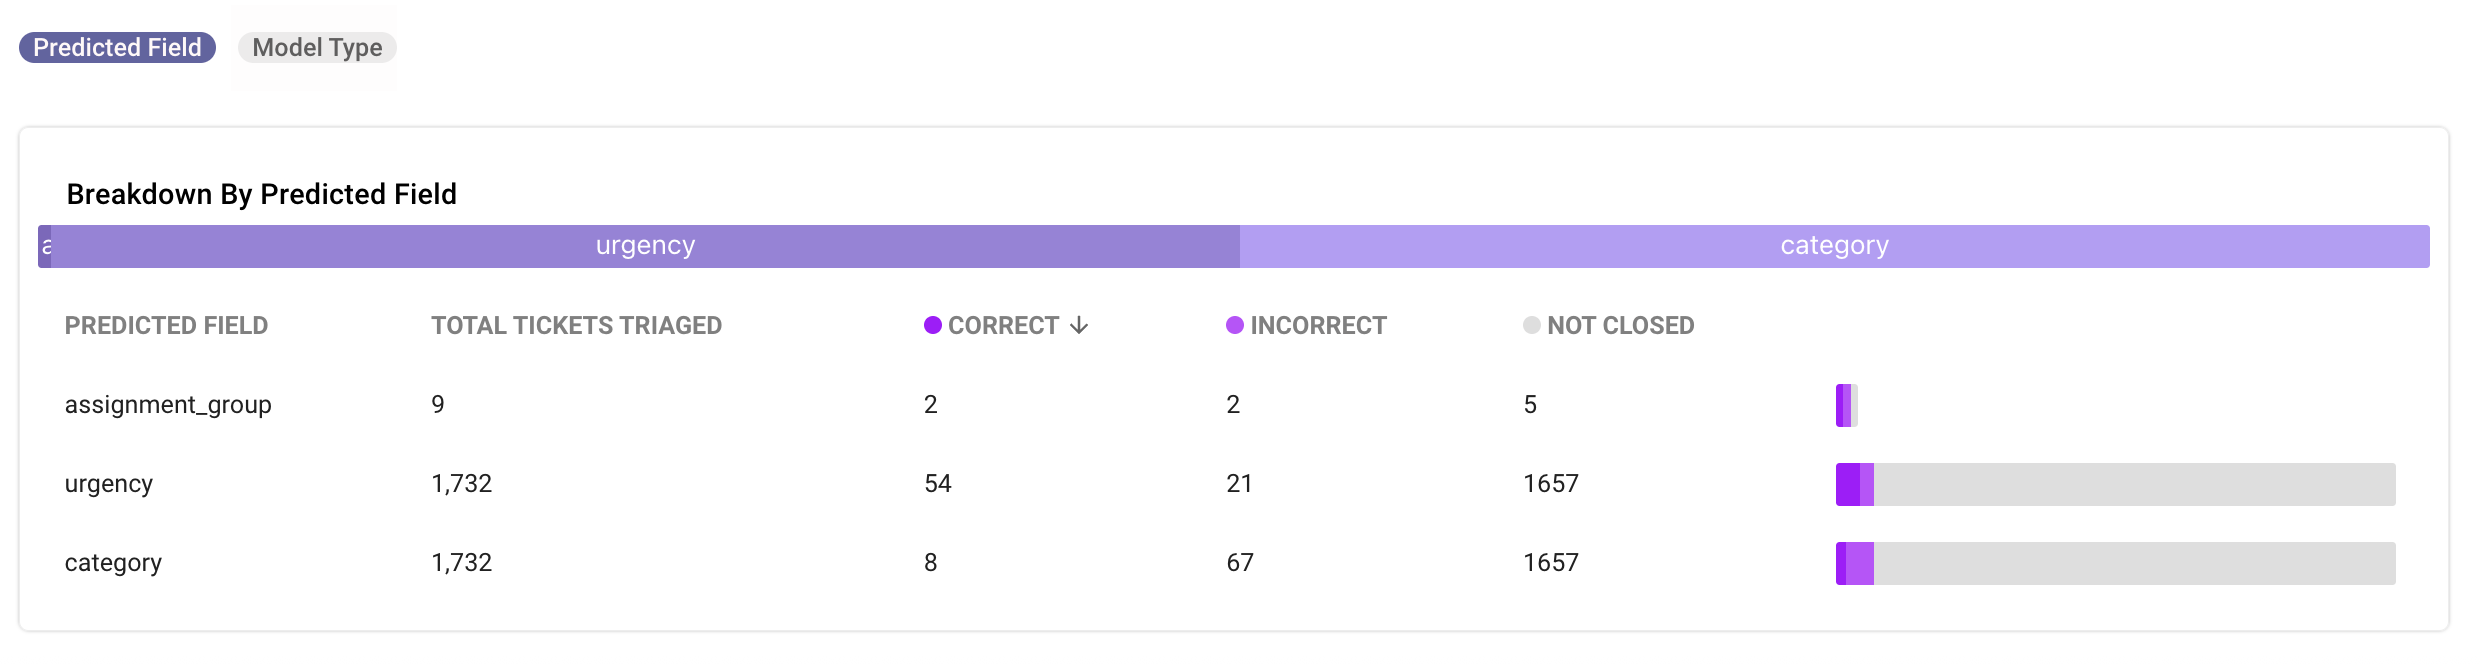
Breakdown of predicted field
This widget has a table that aggregates the performance of each model by predicted field, such as assignment_group, category, subcategory, etc. This is configurable during the initial implementation of Triage.
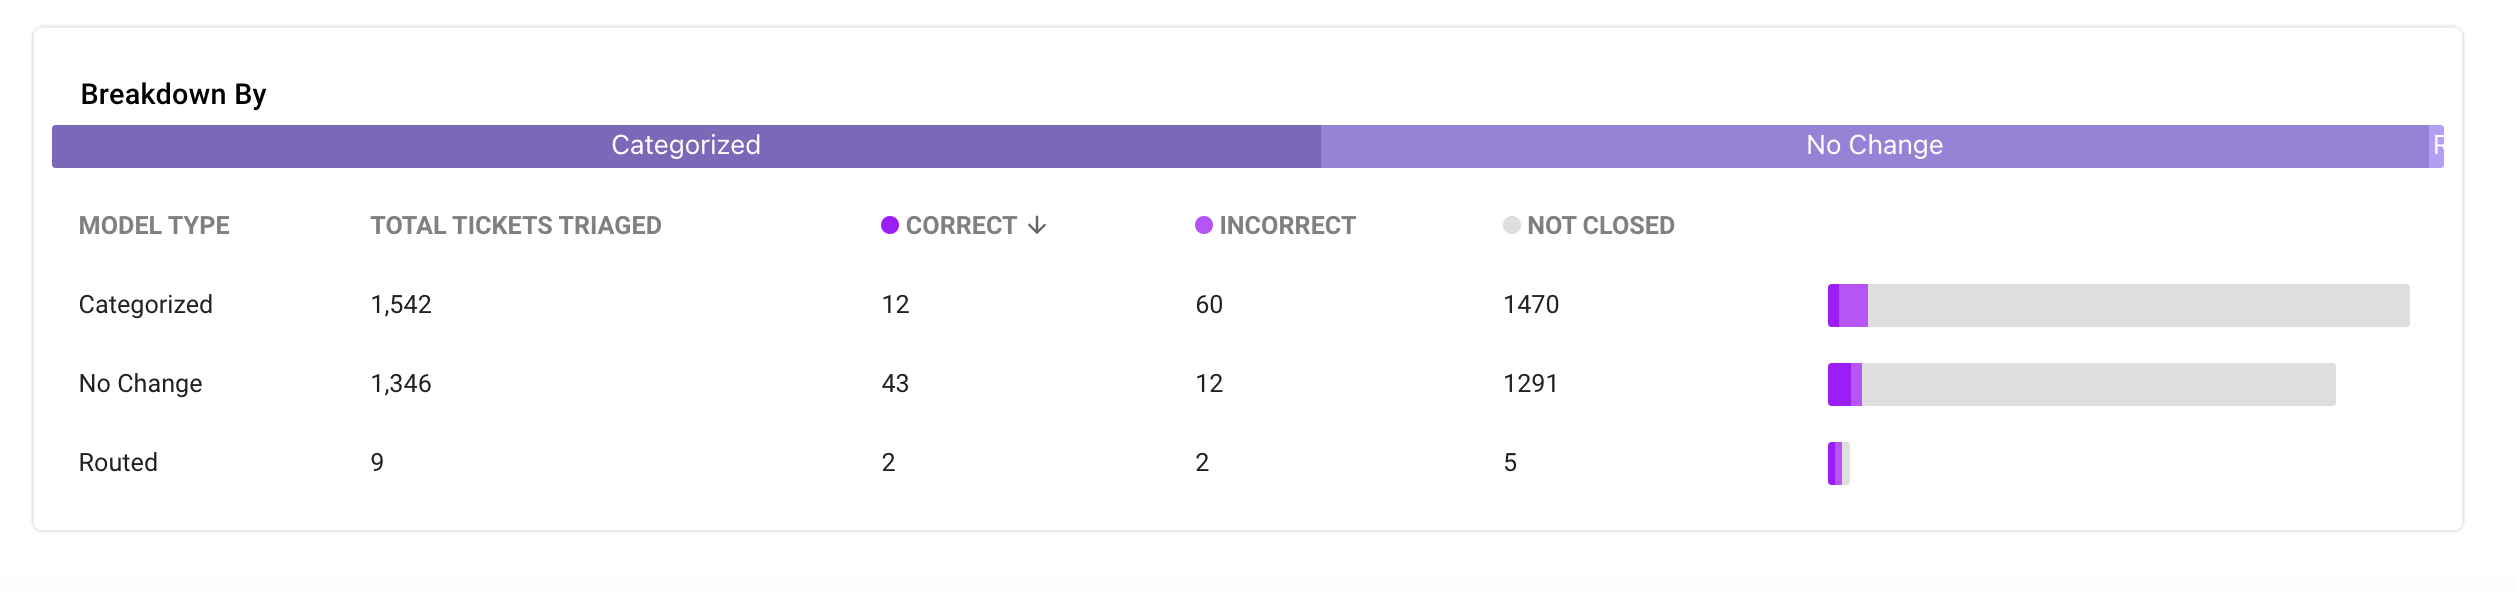
Breakdown of model type
This widget has a table that aggregates the performance of each model by model type, such as Categorized, No Change, and Routed (only 3 values).
FAQ
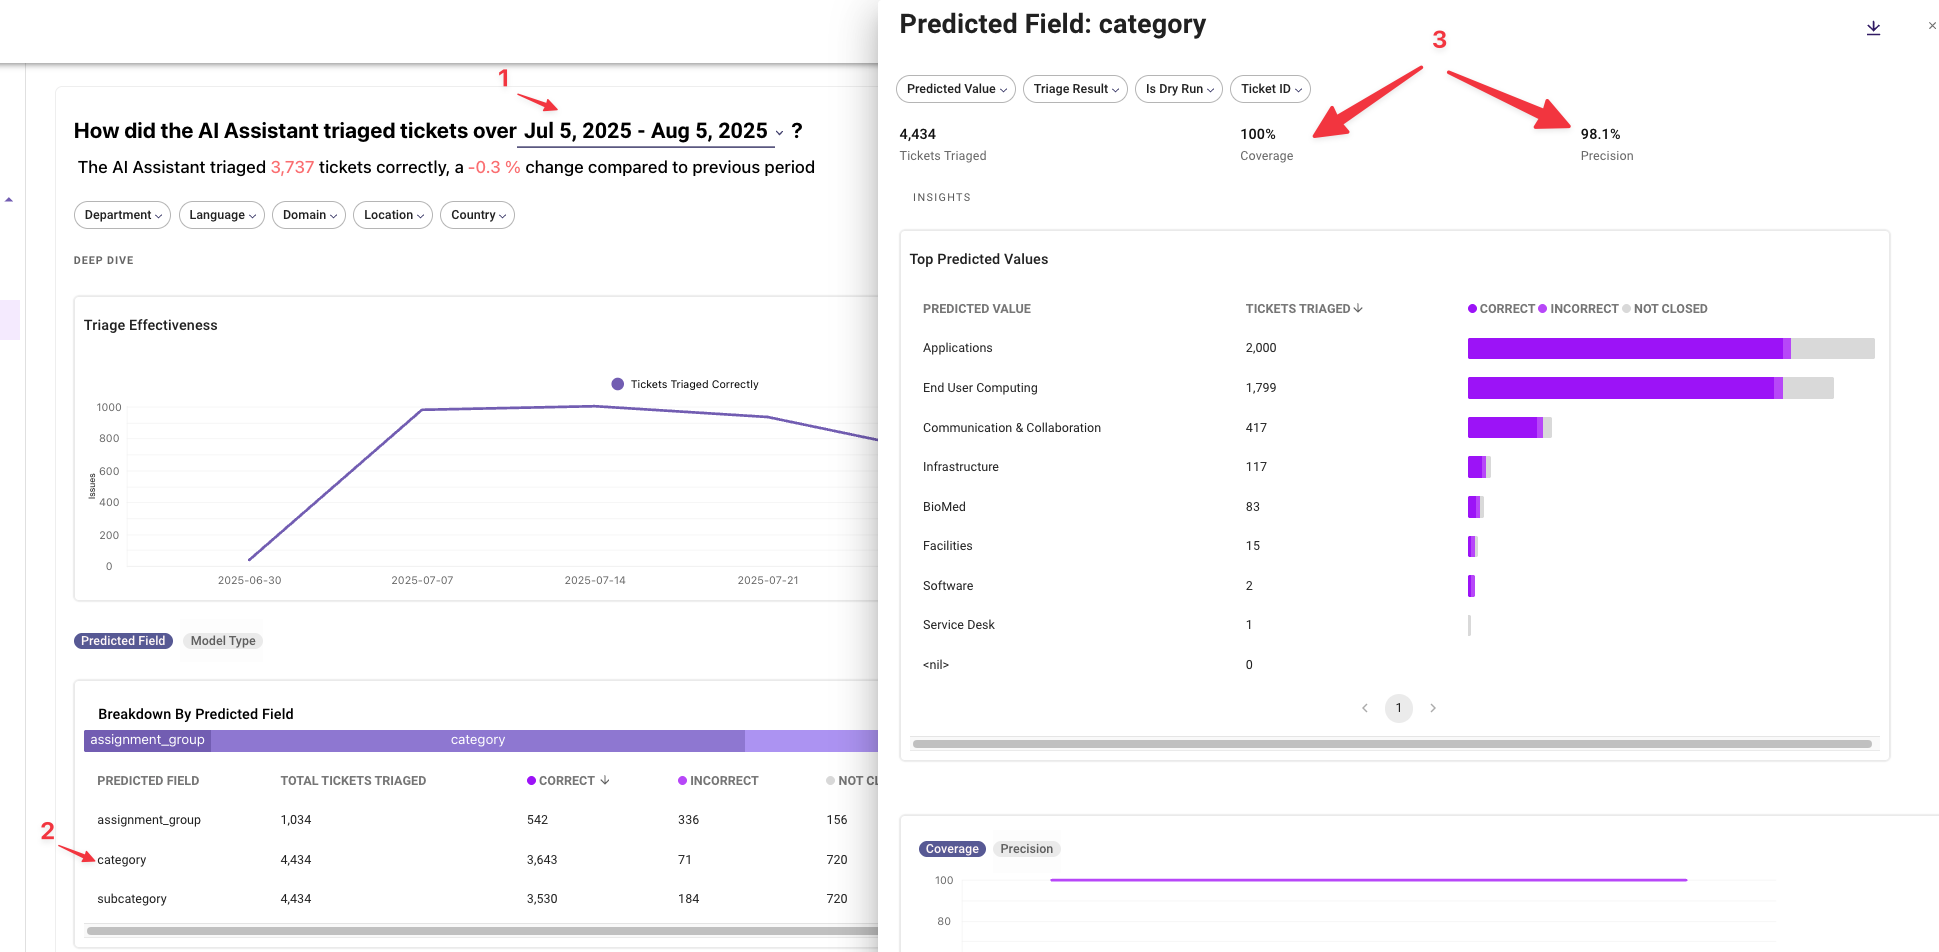
1- How to calculate precision and coverage from Triage Insights?
The best way is to measure these core metrics by each model predicted field. Here are the steps:
- First, ensure you select the right time period, e.g. last month, last three months, etc
- Second, click on the specific
predicted fieldin the table - Third, view the Coverage and Precision metrics from the side view pop-up.
Updated about 1 month ago