Answers Insights
Dashboard
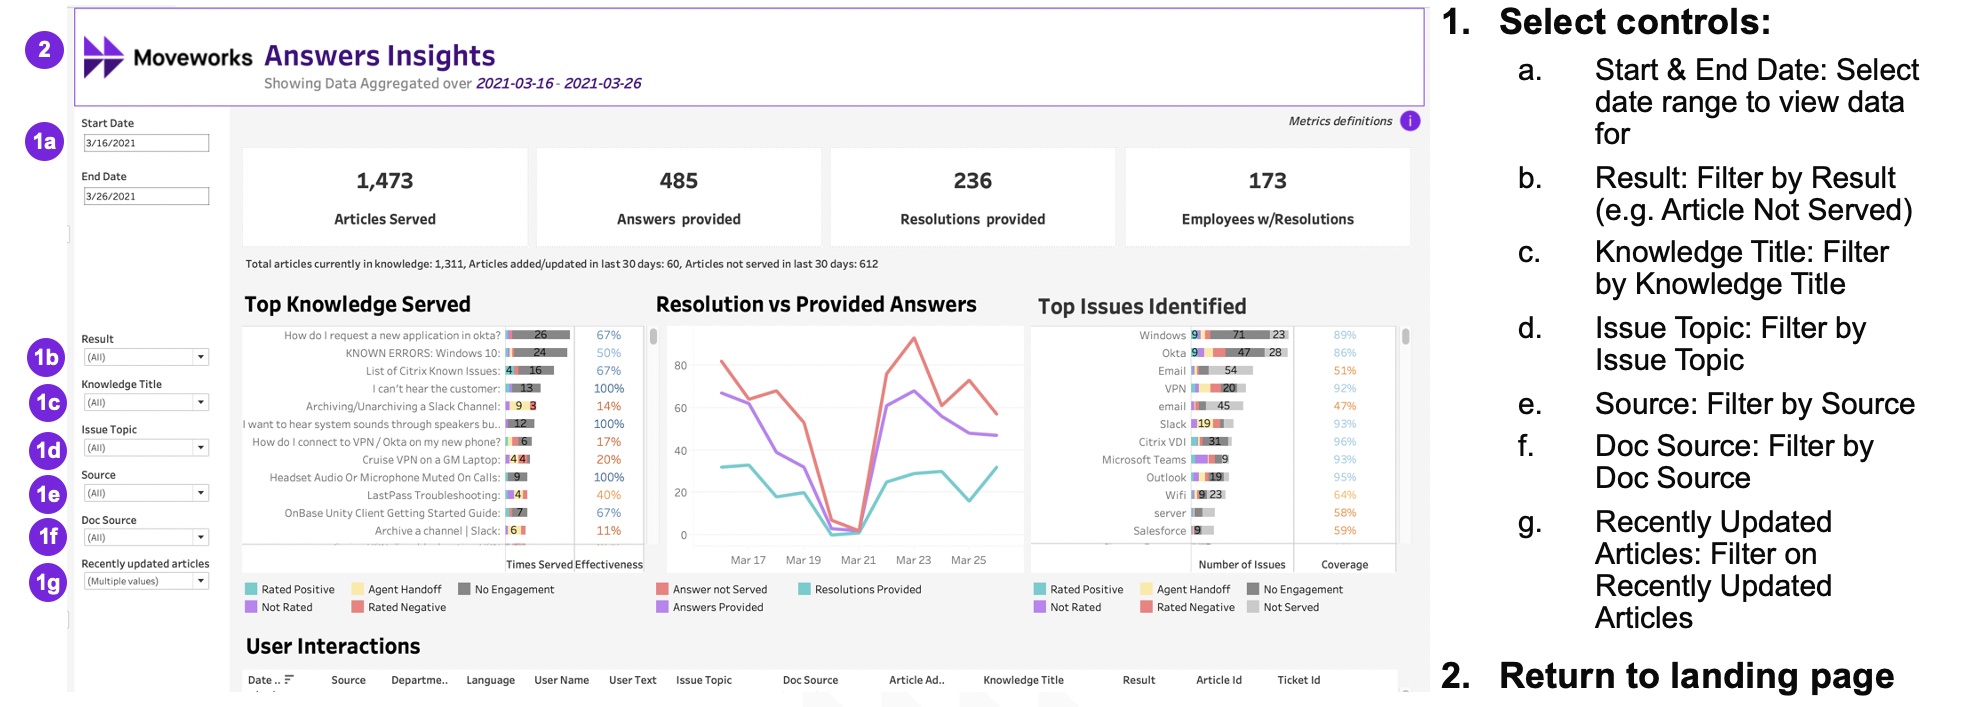
The Answers Insights Dashboard shows the effectiveness of the Answers skill in leveraging knowledge base articles (KBs) and addressing user troubleshooting requests, and includes individual user interactions to allow for troubleshooting. The intended audience for this dashboard is business application owners and KB owners.
Note: On the Answers Insights Dashboard the answers analytics data is only stored for 90 days. For larger timespan analysis please reach out to your Customer Success Manager to get a data-dump.
Best Practices
- The Resolutions vs. Provided Answers graph can show how answers provided vs. resolutions are trending over time, and if improvements to the KB are resulting in an increasing number of resolutions. Ideally, answers not served would decrease over time, while resolutions provided would increase over time.
- The top knowledge served bar chart can show how articles are performing. Any of these with low effectiveness are worth investigating further. Alternatively, one can focus on articles with a high number of negative ratings or agent handoff.
- The bar chart of the top issues indicates which topics are covered by existing articles. This can help decide which KB articles to create next or which topics have poor performance with existing articles.
Privacy Controls
Due to privacy concerns, by default we mask the username of the utterances in non-IT domains for HR/Enterprise customers. The username values are replaced with the user ID instead.
If you wish to see the unmasked usernames, we are able to grant specific users access to allow them to see the unmasked usernames. Please reach out to [email protected] with the specific users' names or emails to request this access. However, due to employees' privacy concerns, we recommend limiting this access unless absolutely necessary.
Personally identifiable information is currently unmasked in all utterance data.
Metrics Definitions
Articles Served: Number of articles served by the bot in response to employee issues
Answers Provided: The count of cases when the bot provided an answer or link to a KB article(s) or FAQ. If this is a proactive reachout from the bot, we require the user to have engaged with the answer or link.
Resolutions Provided: The count of cases when the bot provided an answer or link to a KB article(s) or FAQ except cases when the employee rated it as not helpful, proceeded to file an ITSM ticket or to Live Chat with an agent, or did not engage with the answer or link when it was a proactive reachout.
Employees w/ Resolutions: The number of unique employees provided with an answer or link to a KB article(s) or FAQ except cases when the employee rated it as not helpful, proceeded to file an ITSM ticket or to Live Chat with an agent, or did not engage with the answer or link when it was a proactive reachout.
Total Articles Currently in Knowledge: The number of Knowledge Base articles (including FAQs) ingested by the bot.
Articles Added or Updated in Last 30 Days: The number of Knowledge Base articles (including FAQs) that were added or updated in the KB during last 30 days.
Articles Not Served in Last 30 Days: The number of articles never served by the bot within the last 30 days.
Top Knowledge Served: Knowledge served most in response to employees requests.
Top Issues Identified: Most frequent software apps detected in employees requests.
Breakdown on Bar Charts
- Rated Positive: Employee confirmed that suggested information was helpful.
- Not Rated: Employee received an answer from the bot with no explicit feedback. If it was a proactive reachout from the bot, the user clicked on the link without providing explicit feedback.
- Agent Handoff: Once bot suggested articles, employee filed a ticket or clicked into Live Chat.
- Rated Negative: Employee indicated that suggested information was not helpful.
- No Engagement: Bot suggested articles to explore but employee did not engage.
- Not Served: No articles were suggested.
- Effectiveness: Ratio of number of cases with positive or no rating to number of all cases with user engagement where the specified article was served.
- Coverage: Ratio of number of cases with answer served to number of all attempts.
Updated about 1 month ago