Executive Insights
Dashboard
The Executive Insights dashboard was built to provide a single snapshot view of how the Moveworks bot performs. The dashboard covers key metrics such as number of issues resolved, issues that the bot accelerated, and time savings for the service desk— allowing users to view data in trailing windows ranging from the most recent week to the last 12 months.
Who this is for
The intended audience for the Executive Insights dashboard is CIOs or executive leadership who want a holistic view of how the Moveworks bot is performing.
Interacting with the dashboard
Select time frame: period from the latest calendar week or month, from the last week all the way to the start of the bot’s deployment time.
View definitions: Hover over the question mark-shaped tooltip to see the definition of each metric listed.
Trend line: Hover over the trend line to view the number of issues over the selected time period
Homepage: Click on the header section to return to the homepage.
Time Selection
Time Period Selection
Metrics are available for the following time periods that can be chosen in the time period filter on the left sidebar:
- Week (last complete calendar week)
- Last month (last complete calendar month)
- Last 3 months (last 3 complete calendar months)
- Last 6 months (last 6 complete calendar months)
- Last 12 months (last 12 complete calendar months)
Visualization Look back interaction
Each data point on the line chart represents 1 week’s worth of data for issues resolved or accelerated.
In order to show a meaningful trend, the Executive Insights dashboard defaults to a 3-month look back time period if time period is set to:
- Week
- Last Month
- Last 3 months
Look back period increases to 6 months if the time period is set to “Last 6 months” and to the last 12 months if the time period is set to “Last 12 months”.
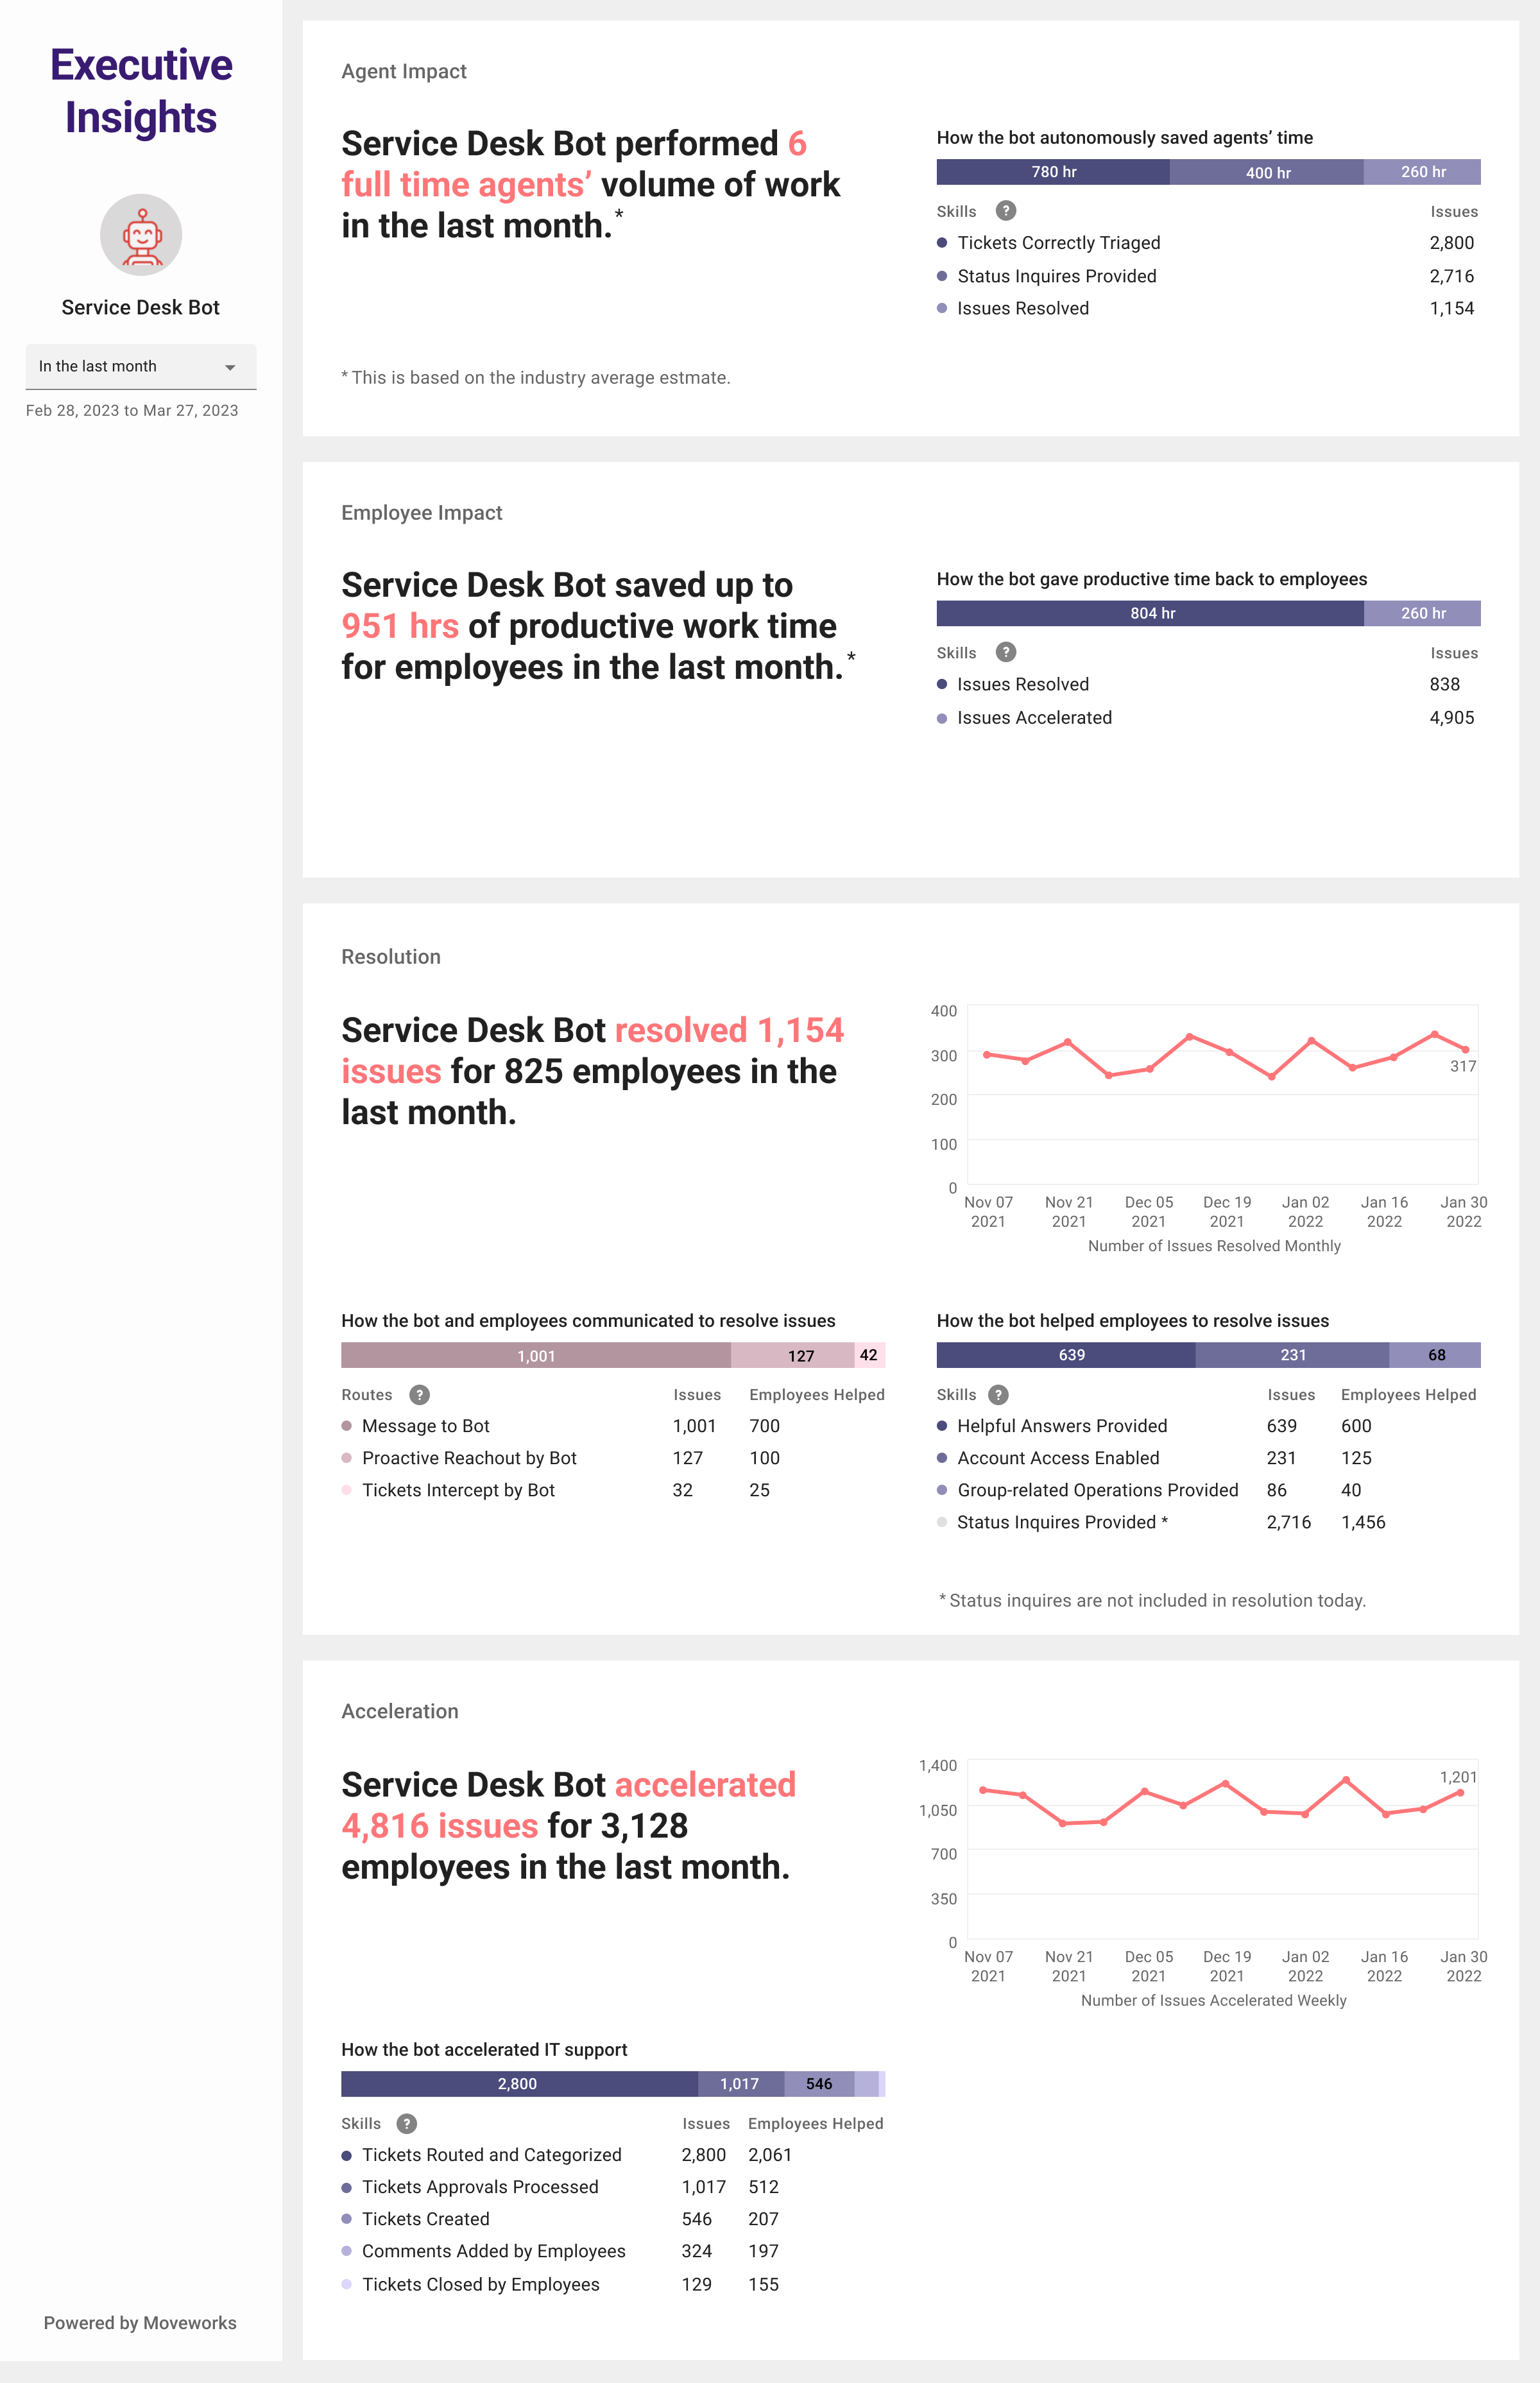
Agent Impact
Goal
- Understand how to bot eliminates work for service desk / does the equivalent work of full-time agents
- Visualize how issues accelerated are trending over time (for the selected time period)
- See breakdown of issues resolved by Moveworks skills
- General explanation (plain text)
- Description of visualization
Metrics definition
Number of the full-time agents is calculated assuming a full-time agent works 8 hours per workday.
Number of cases that are saving agents time fall into the following categories:
Tickets Routed and Categorized: The bot categorizes and routes tickets to an appropriate help desk. There are up to 4 types of machine learning classification models that help reduce work for the service desk.
- Routed: Tickets routed to the appropriate support group. This generally refers to tickets that are updated on a routing field, such as Assignment Group and Components.
- Transferred: Call tickets transferred to another table. This generally refers to tickets that are updated on a call type field, usually getting classified as either Incident or Request
- Categorized: Tickets labeled. This generally refers to tickets that are updated on non-routing descriptive fields, such as Category, Subcategory, and Configuration Item.
- No Change: This triage model predicts that there are no fields or Assignment Groups that need to be changed for a given ticket.
Status Inquiries Provided: Bot provided requested update on the ticket status.
Issues Resolved: Bot resolved employee issues.
Agents time saved is calculated according to the formula:
48 minutes per search case of resolved issue +
1 minute per each case of checking a ticket status +
1 minute per ticket correctly triaged
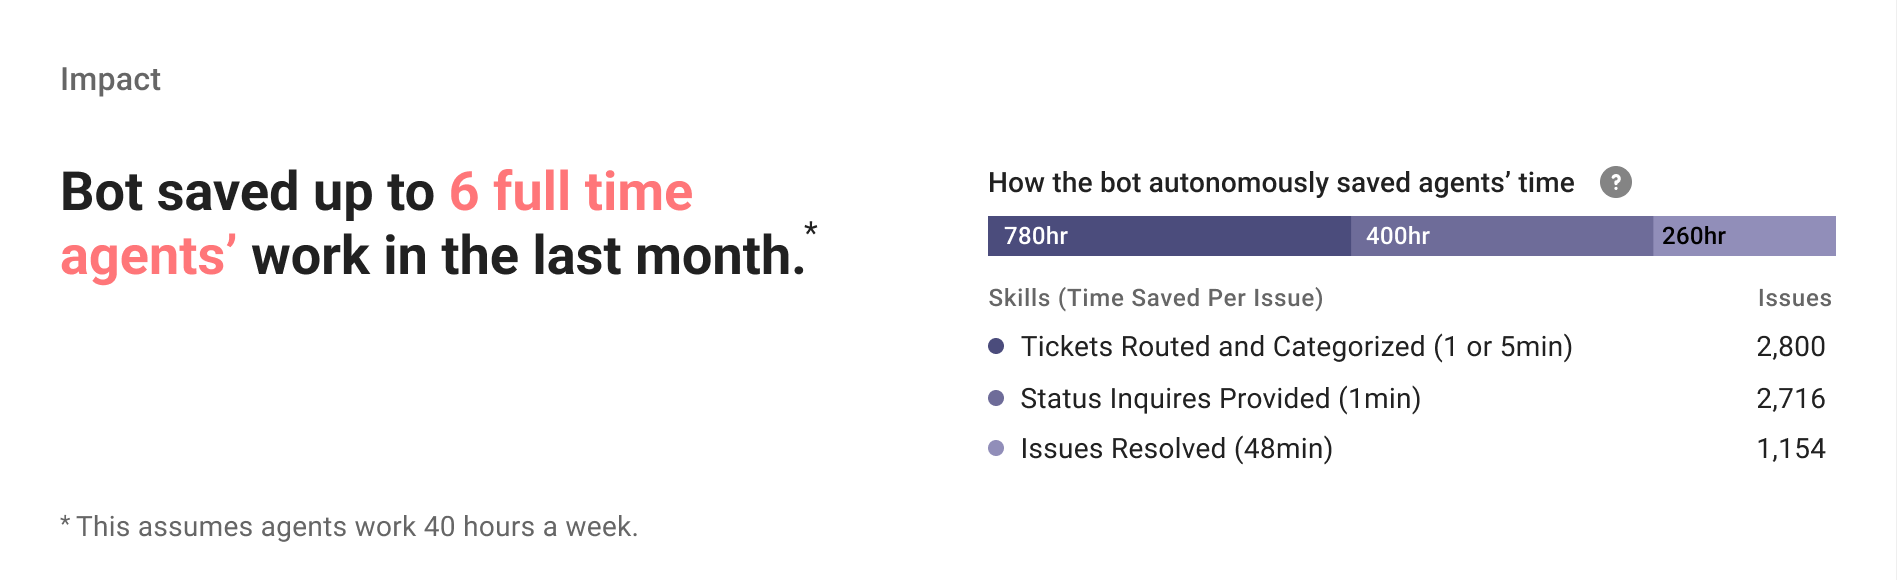
Employee Impact
Goal
- Understand how the bot saves productive working time for employees who use the bot
Metrics definition
- Each issue resolved is assumed to save employees 57.6 productive minutes.
- Each issue accelerated is assumed to save employees 1.8 product minutes.
Please see the Employee Time-Saving documentation for more details.
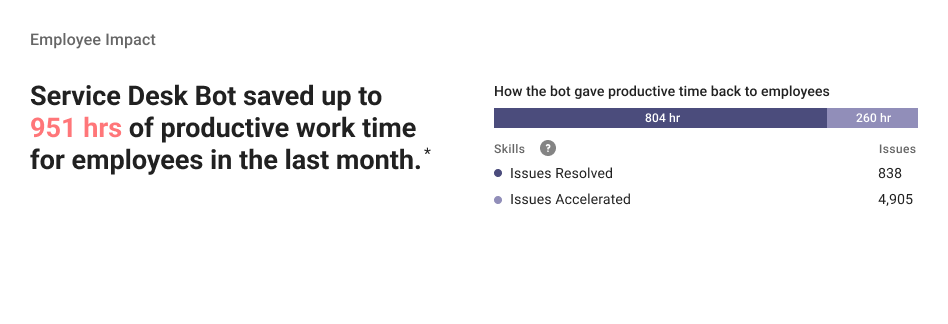
Resolution
The resolution section examines how many issues are resolved by the bot over the selected time period.
Goal
- Understand how many issues is the bot able to resolve using all of its capabilities, and across all relevant routes in bot and ITSM
- Visualize how issues resolved are trending over time (for the selected time period)
- See breakdown of issues resolved by Moveworks skills and bot-relevant routes
Description of visualization
The visualization is a line chart that trends over the selected time period.
Metrics definition
Number of issues resolved: Number of cases when bot helped employees to resolve their work-related issues. See below for detailed definition of various issues resolved by bot
Number of employees helped: Number of unique employees that had their issues resolved by bot.
Bot resolves employees issues that can be manifested in multiple ways:
Message to Bot: Employees proactively reach out to bot to resolve their issues.
Proactive message by Bot: The bot identifies a potential issue and messages an employee to resolve it.
Tickets intercepted by Bot: The bot detects a ticket has been filed, and reaches out to the employee to resolve the issue.
In Channels: The bot detects an issue on a shared channel, and reaches out to the employee to resolve the issue
Employees' issues can be resolved by bot by leveraging appropriate resources:
Helpful Answers Provided: Bot provided answers that were rated helpful by an employee or not rated explicitly. This excludes answers that were rated negatively
Account Access Enabled: Bot allowed employees to reset passwords or unlock accounts
Group-related Operations Provided: Bot created or changed membership for groups and distribution lists
Software Access Enabled: Bot provided access to a software application
Forms Filled: Employees filled a form or structured request recommended by bot
In addition, bot helps employees to check on their tickets status. This is not considered to be a case resolved by bot:
Status Inquiries Provided: Bot provided requested update on the ticket status
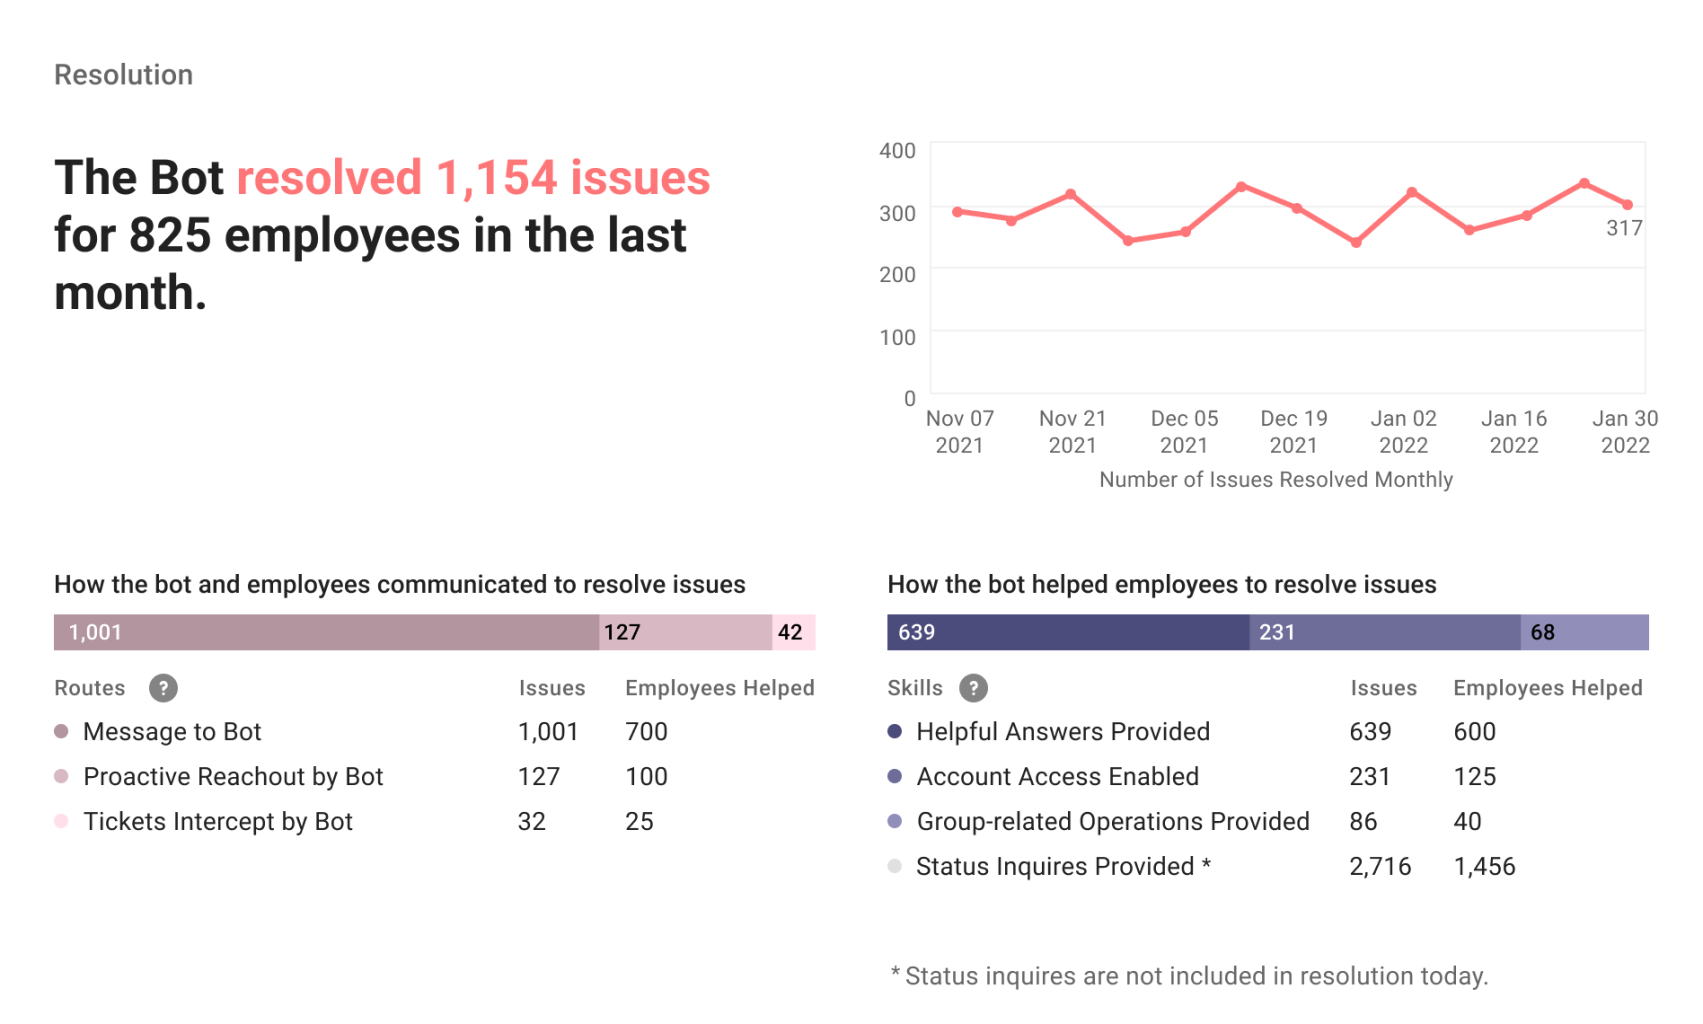
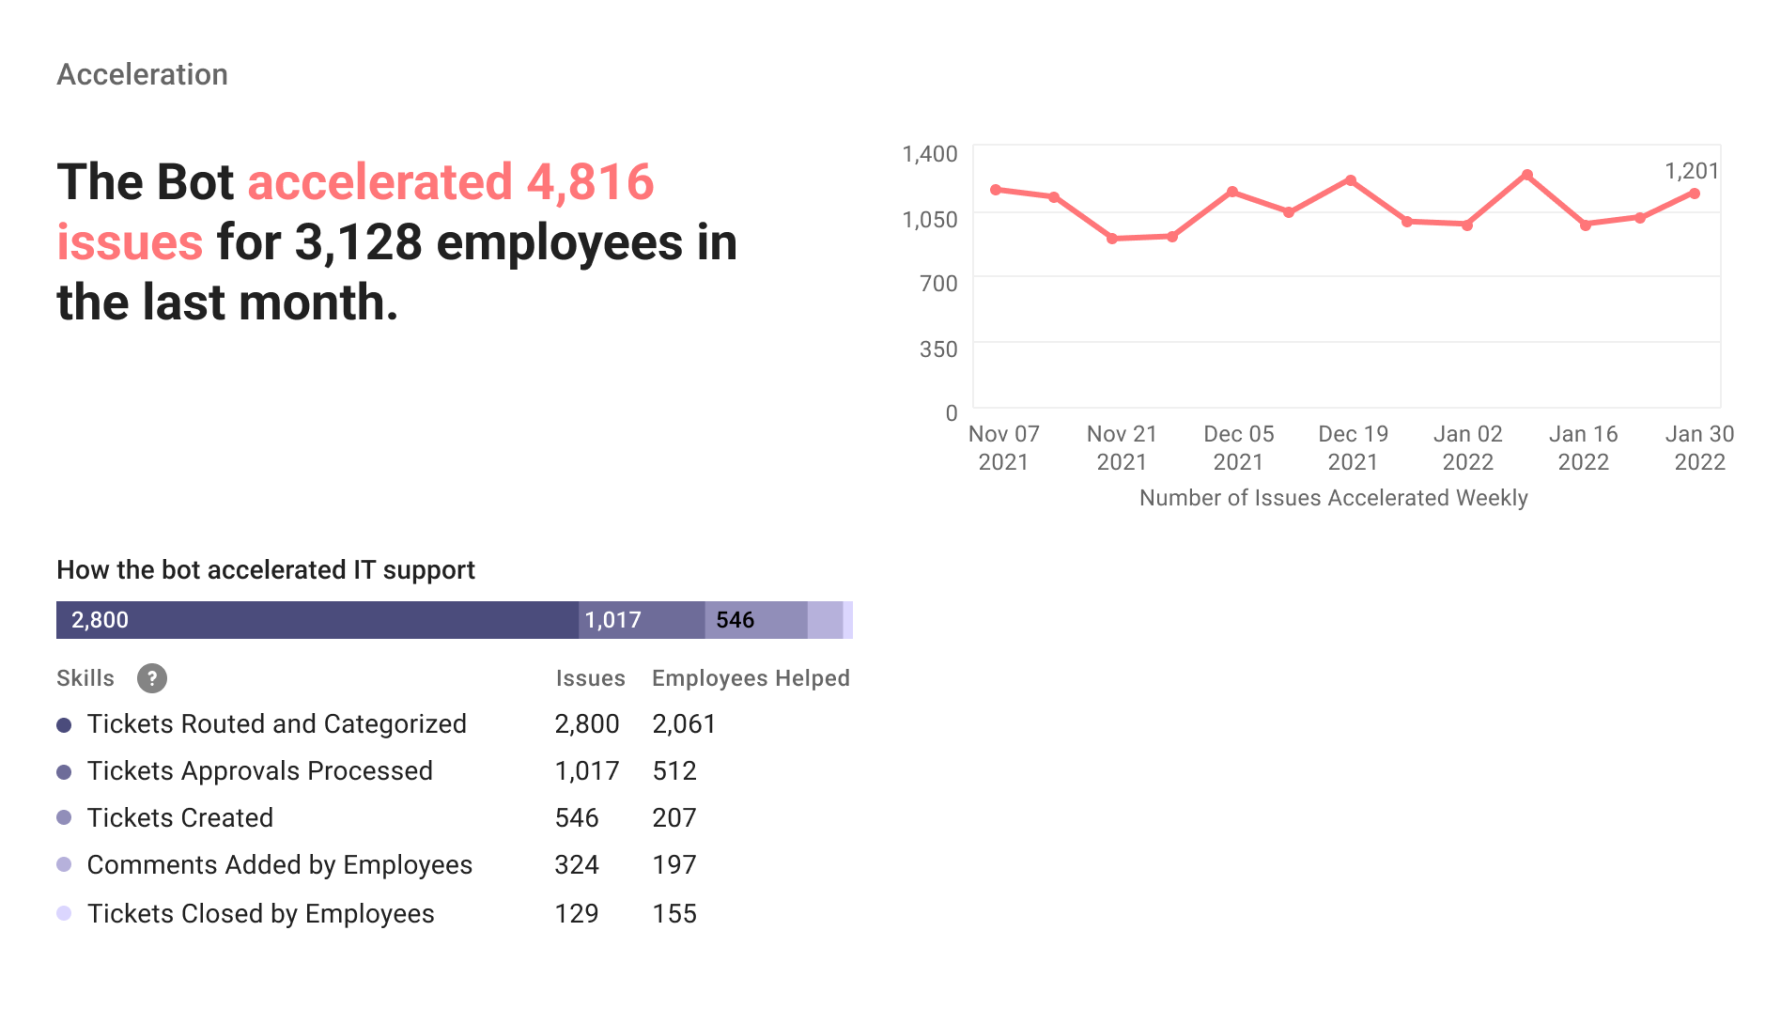
Acceleration
Goal
- Understand how many issues the bot speeds up for employees if it is unable to resolve the issue for them.
- Visualize how issues accelerated are trending over time (for the selected time period)
- See breakdown of issues resolved by Moveworks skills
- General explanation (plain text)
- Description of visualization
Metrics definition
Number of issues accelerated by bot: Number of issues where bot sped up handling of an issue by an agent and/or employee.
Tickets Routed and Categorized: The bot categorizes and routes tickets to an appropriate help desk. There are up to 4 types of machine learning classification models that help accelerate issues
- Routed: Tickets routed to the appropriate support group. This generally refers to tickets that are updated on a routing field, such as Assignment Group and Components
- Transferred: Call tickets transferred to another table. This generally refers to tickets that are updated on a call type field, usually getting classified as either Incident or Request
- Categorized: Tickets labeled. This generally refers to tickets that are updated on non-routing descriptive fields, such as Category, Subcategory, and Configuration Item
- No Change: Model predicts that the value of the tickets stay the same. This normally shows the most values if you prefer majority of the tickets to stay in the L1 service desk groups.
Tickets Approvals Processed: Employees approve or reject approval requests using the bot
Tickets Created: Employees create tickets using the bot
Comments Added by Employees: Employees comment on their tickets using the bot
Tickets Closed by Employees: Employee resolve or close their tickets using the bot
Requests for Ticket Update: Employees ask agent to act on tickets without recent activity
Number of employees helped: Number of unique employees who are requestors or actor on an accelerated issue
FAQ
Q: What is the goal of the new Executive Insights experience? Why did you build it?
A: The new Executive Insights dashboard presents Moveworks’ latest thinking on how the bot provides value and impact to your service desk. Various bot-related skills and metrics are framed in context of how they help your service desk resolve issues, speed up issues for
Q: How do you calculate 48 minutes per issue resolved?
A: From analysis across all our customers, we determined that the average agent resolved 50 issues a week on average. Assuming a 40 hour work-week, this leads to 40 hours / 50 issues = 48 minutes / issue.
Q: How do you get access to dashboard?
A: We will send you report through email, and you should be able to log into Tableau to view these reports yourself by visiting trust.moveworks.com and clicking on Executive Insights.
Q: How similar is the data on the new Executive Insights dashboard to other Moveworks performance insights dashboard?
A: The data in the new Executive Insights dashboard should not vary from other Performance Insights dashboards by more than 5%. The reason for this variance is that values in our new Executive Insights are aggregated from the same underlying tables at certain fixed intervals, and there can sometimes be minor variations in how this data is aggregated. For most Moveworks skills this variance should be minimal.
Q: Why is there a discrepancy between the number of issues resolved at a skill level versus an aggregate level?
A: This discrepancy occurs because there are some edge-case issues that get counted as resolutions for multiple skills, in this case Account Access and Answers. Since Skills Insights breaks out resolutions by skill type, it can count the same resolution twice, once for each skill that it's attributed to. Resolutions Insights aggregates resolutions from all skill using a COUNT DISTINCT and thus only counts each resolution once.
Q: Will I receive an email or bot message with the new executive insights dashboard?
A: For the duration of the pilot program, you will only be able to access the new Executive Insights dashboard through tableau. A few weeks after the completion of the pilot program, you can opt into receive email updates with exports of the new Executive Insights dashboard. Please get in touch with your customer success team to share how frequently you would like to receive these updates.
Q: How do I specify the exact start and end dates on the new Executive Insights dashboard?
A: The new Executive Insights dashboard defaults to looking back from the most recent time period (most recent week or most recent calendar month). We do not currently allow users to customize the start and end dates. This was designed to ensure we had a simple way to reason about the Bot performance over a calendar week or month, and to create a fast and performant dashboard experience.
Q: Why are “status inquiries” listed as a resolution skill?
A: Today, checking the status of your tickets does not count towards ticket resolution.
Q: Between my Quarterly Impact Reviews and other Performance Insights dashboards, which data should I pay attention to?
A: While Quarterly Impact Reviews are prepared by your CSMs as a more tactical and operational view of how to maximize your bot impact, the new Executive Insights is designed to be a self-serve resource that allows you to evaluate your bot’s impact and value through a single page experience. Both resources should complement each other, and you should see the effects of taking action on your QIRs in your metrics.
Q: Why are there differences in numbers between my Impact Insights dashboards and Executive Insights dashboards
A: There might be up to 5% differences in data calculated between Impact Insights and Executive Insights. The main reason has to do with the way data is prepared between dashboards. Executive Insights aggregates and sums up metrics for pre-defined time periods once a week. However impact insights calculates data on the fly each time a time period is selected. This can lead to minor differences in metrics between the two dashboards.
Q: Why are the line graphs not updating according to the selected date range?
A: Executive Insights is meant to provide a high-level overview of bot impact and therefore the graphs are static. For insights into the selected date range, please use Bot Performance Insights, where you will can select a flexible date range and see the dynamic line graph.
Updated about 1 month ago