Enterprise search insights
Overview
Enterprise Search Insights (also referred to as Search Insights) is a dedicated analytics report for Enterprise Search. It gives administrators, Moveworks champions, and content owners visibility into how Enterprise Search (web/search mode) is being used across the organization, which content and systems are serving results, and where the search experience can be improved.
Unlike AI Assistant Insights, which is built around multi-turn conversations and resolutions, Search Insights is built around search sessions and queries — the navigational and keyword-discovery interactions that happen in Enterprise Search. Because Enterprise Search and the AI Assistant are fundamentally different surfaces, Search Insights is delivered as a separate report.
The report is organized around three questions an admin asks when they open it:
- Who is using Enterprise Search? — adoption and usage.
- What are users doing on Enterprise Search? — clicks, filters, and “dive deeper” engagement.
- How to improve Enterprise Search? — system connectivity and content performance.
Enterprise Search Insights excludes metrics and interactions of test users. These users are tagged with a “tester” tag in Moveworks. Please refer to user identity mapping in Moveworks Setup to understand which users are classified as test users.
How to access the report
Enterprise Search Insights is available under the analytics application on the navigation sidebar. Open the analytics application and select Enterprise Search Insights from the left navigation.
Users with a “Bot analytics admin” or “Bot analytics viewer” role for the analytics application can access this report. If a user cannot see the report, please add the required role using the Roles and Permissions (RBAC) tool.
Key terms used in the dashboard
Filters and views
Date range
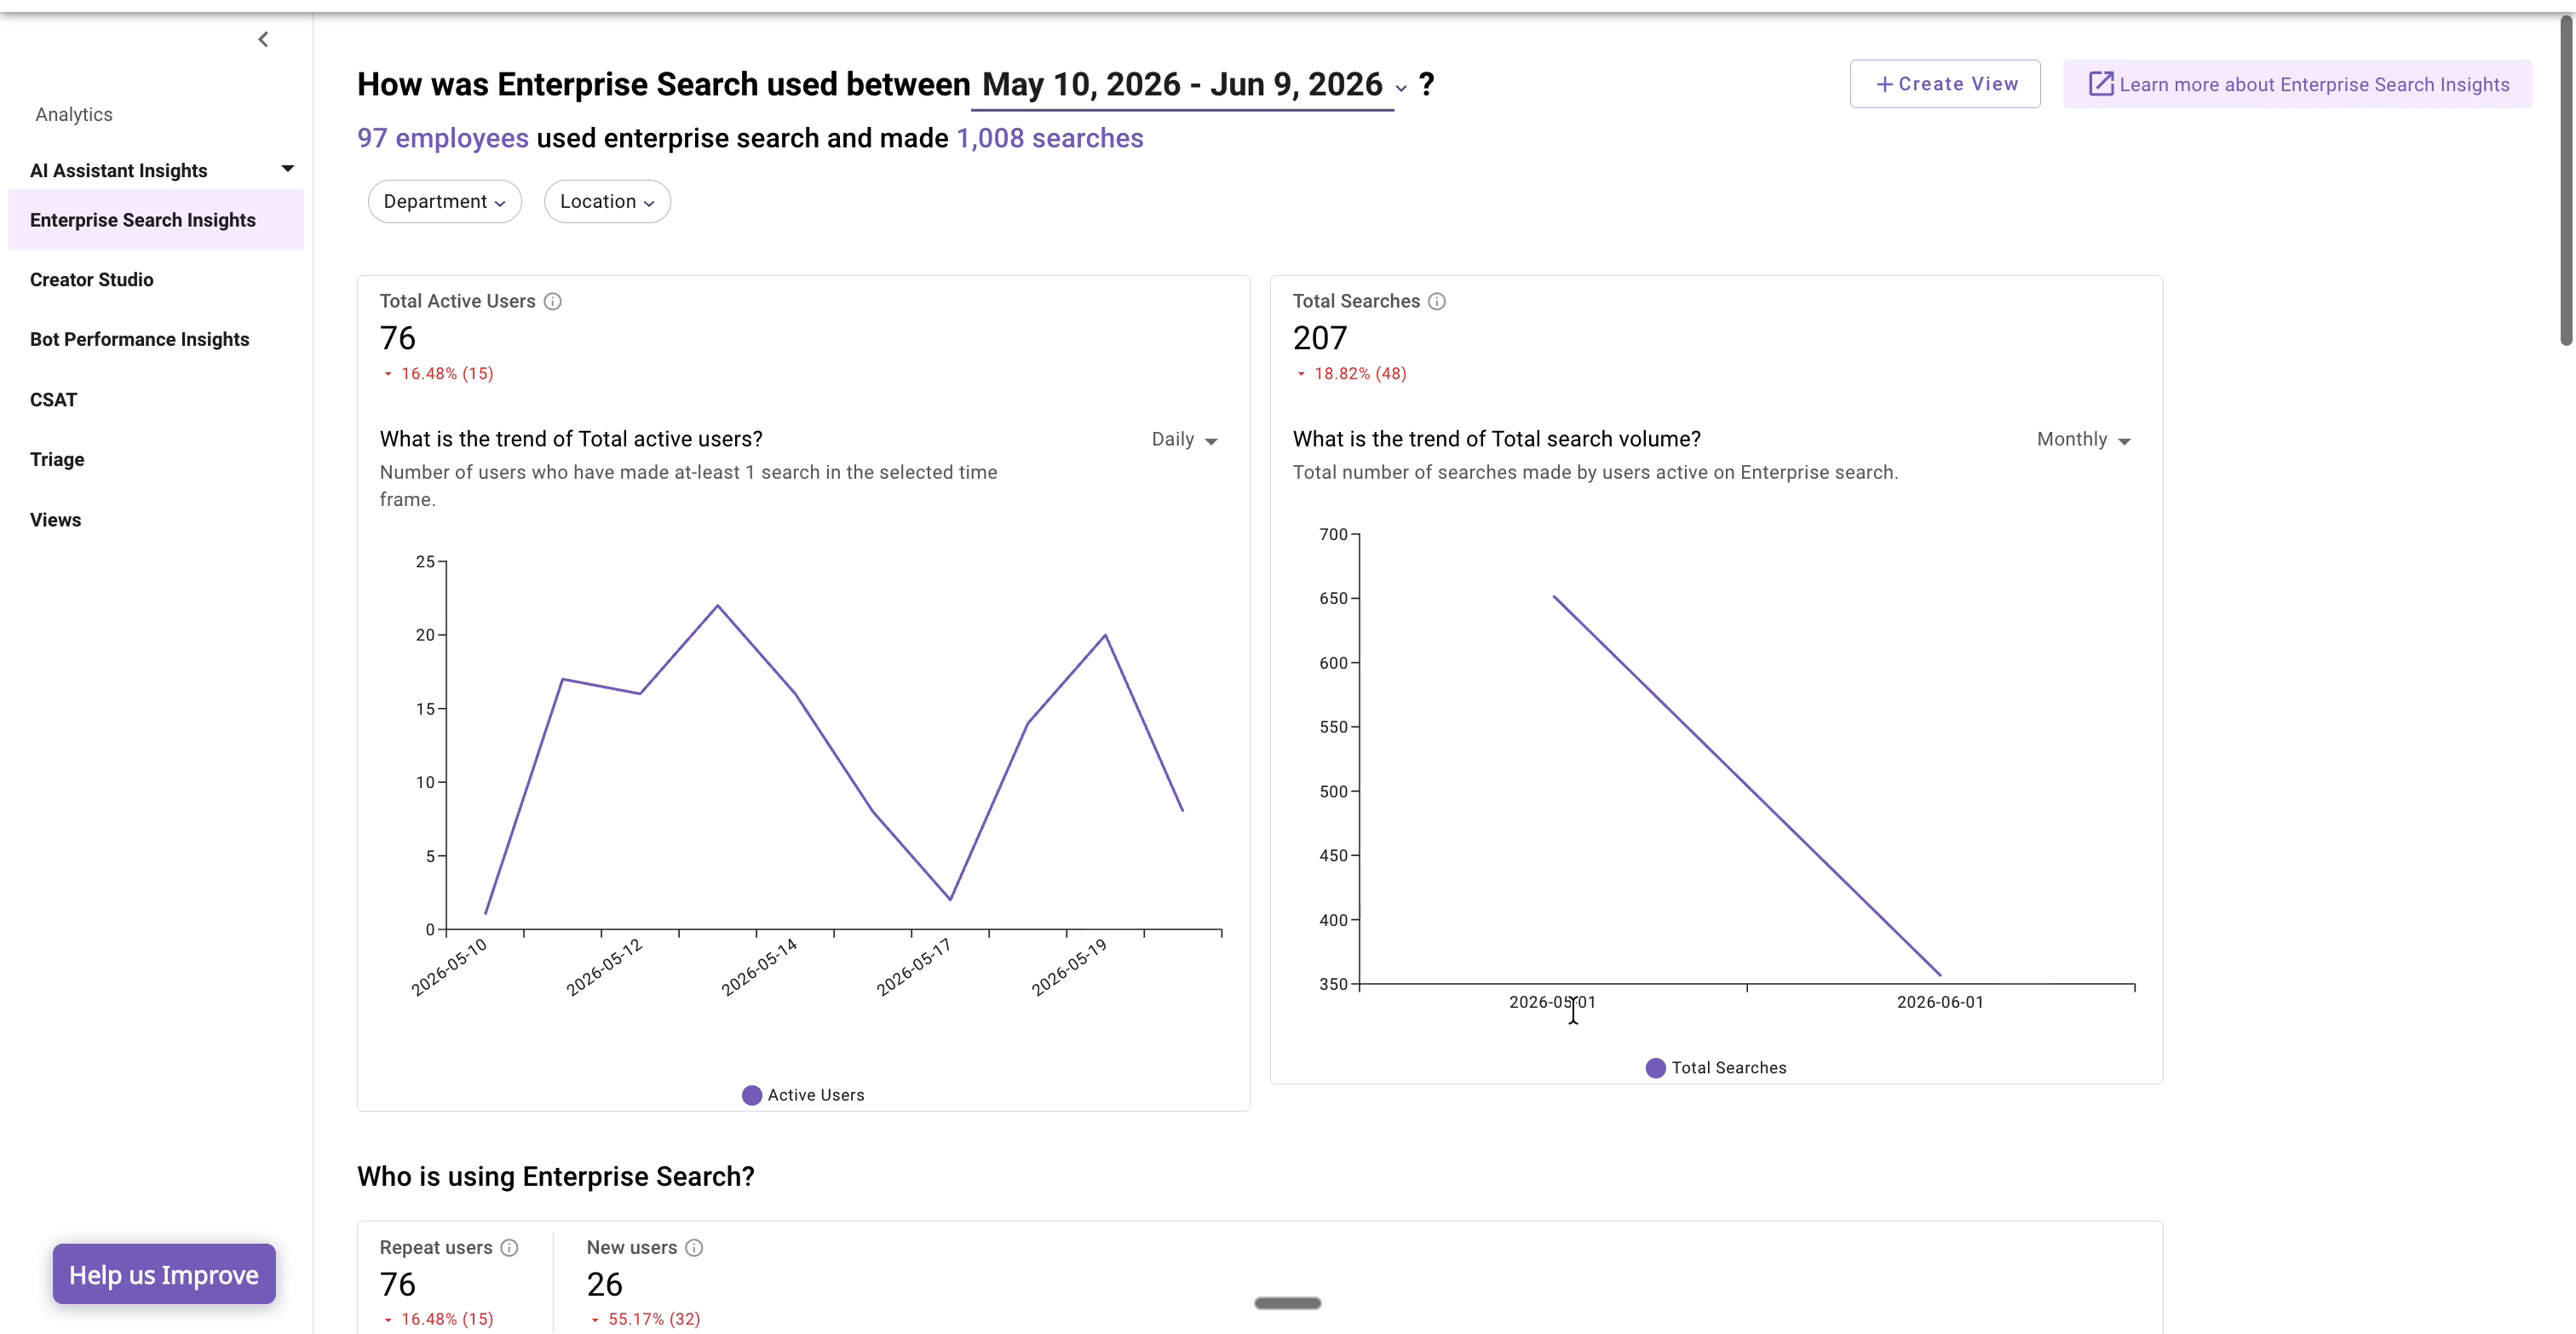
The report header — “How was Enterprise Search used between <start> – <end>?” — includes a date-range selector. Use it to change the reporting window; every widget on the report reflects the selected range, and stat cards show the change versus the previous comparable period.
Department and Location
Two top-level filters, Department and Location, scope the entire report to a user segment. These values are ingested from the external system used in user identity.
Example use case: I want to see Enterprise Search usage for one department — select the Department filter, choose the department, and apply it. All widgets then reflect only users in that department.
Create View
Use Create View (top right) to save a filtered configuration of the report so you can return to a specific segment or time window without re-applying filters each time.
Deep dive into widgets
Who is using Enterprise Search?
Total Active Users and Total Searches are the two headline stat cards. Each shows the value for the selected period along with the percentage change versus the previous period, so you can see adoption direction at a glance.
- What is the trend of Total active users? — a daily trend of unique users who made at least one search. This is the top-of-funnel adoption signal for Enterprise Search.
- What is the trend of Total search volume? — a trend of total searches made by active users, establishing whether usage is growing, stable, or declining.
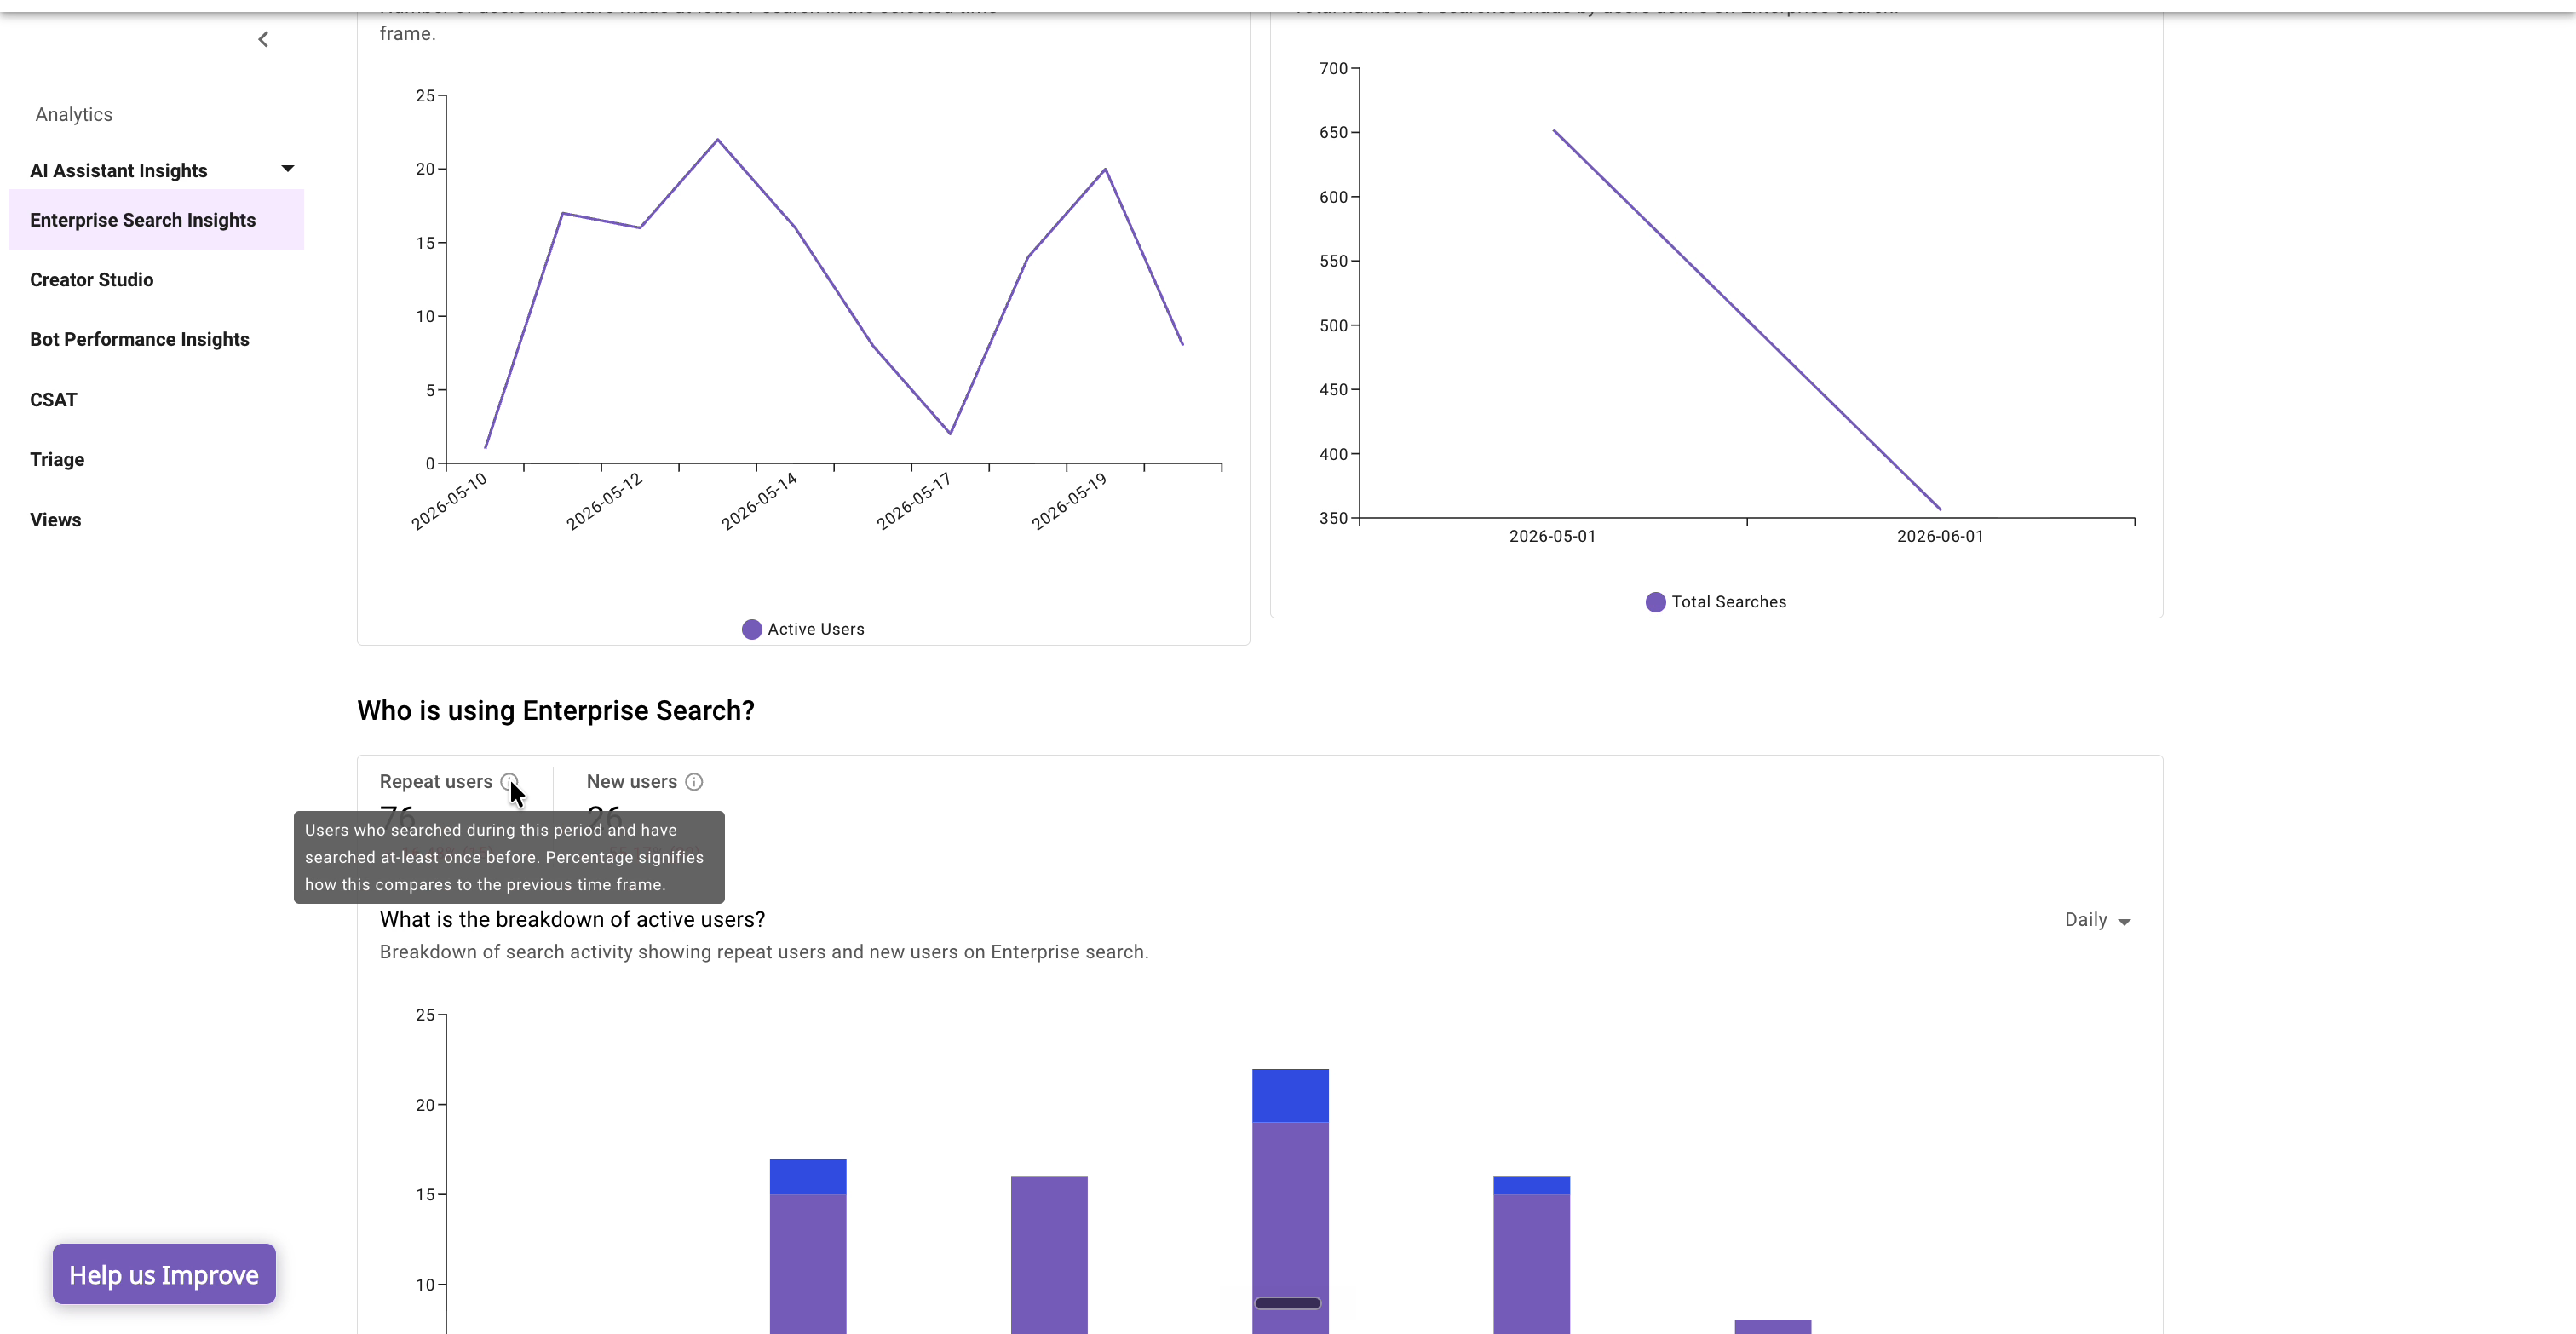
The Who is using Enterprise Search? section then breaks adoption down further:
- Repeat users and New users stat cards.
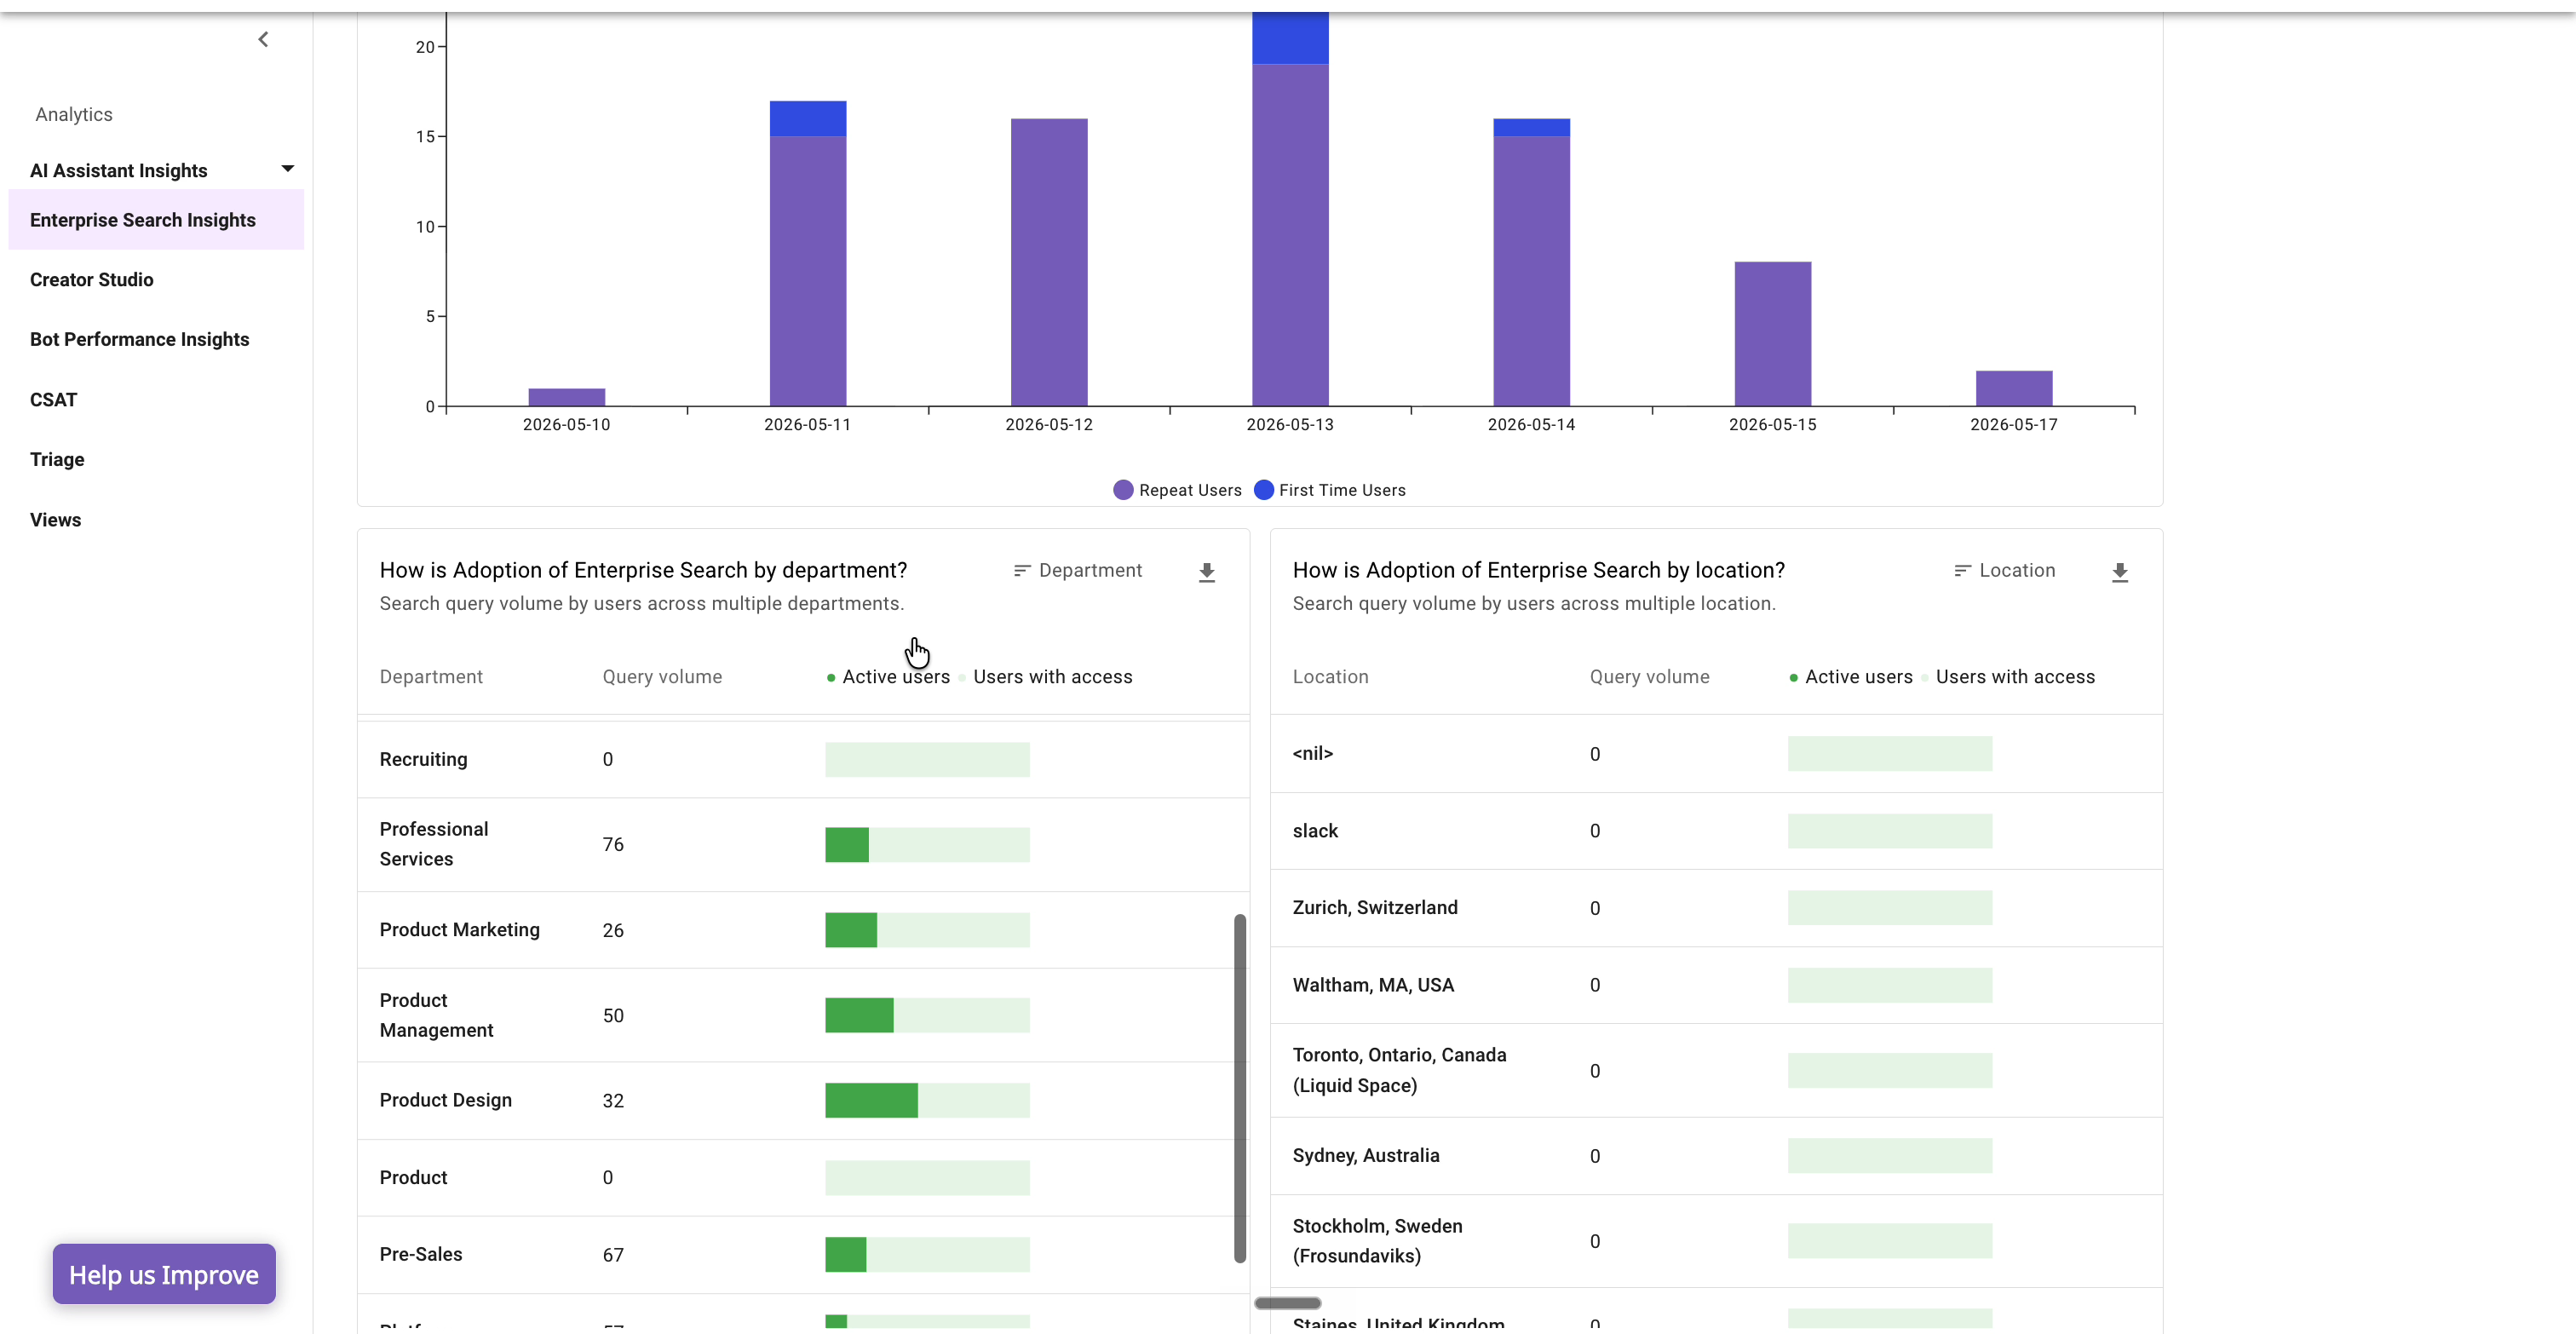
- What is the breakdown of active users? — a stacked chart of repeat versus first-time users over time, showing how much usage comes from returning users versus newly adopting ones.
Adoption deep dive — by department and by location
Two tables break adoption down by segment:
- How is Adoption of Enterprise Search by department?
- How is Adoption of Enterprise Search by location?
For each segment the table shows query volume, active users, and users with access — so you can see both how much a segment uses Enterprise Search and how that compares to the eligible population that has access.
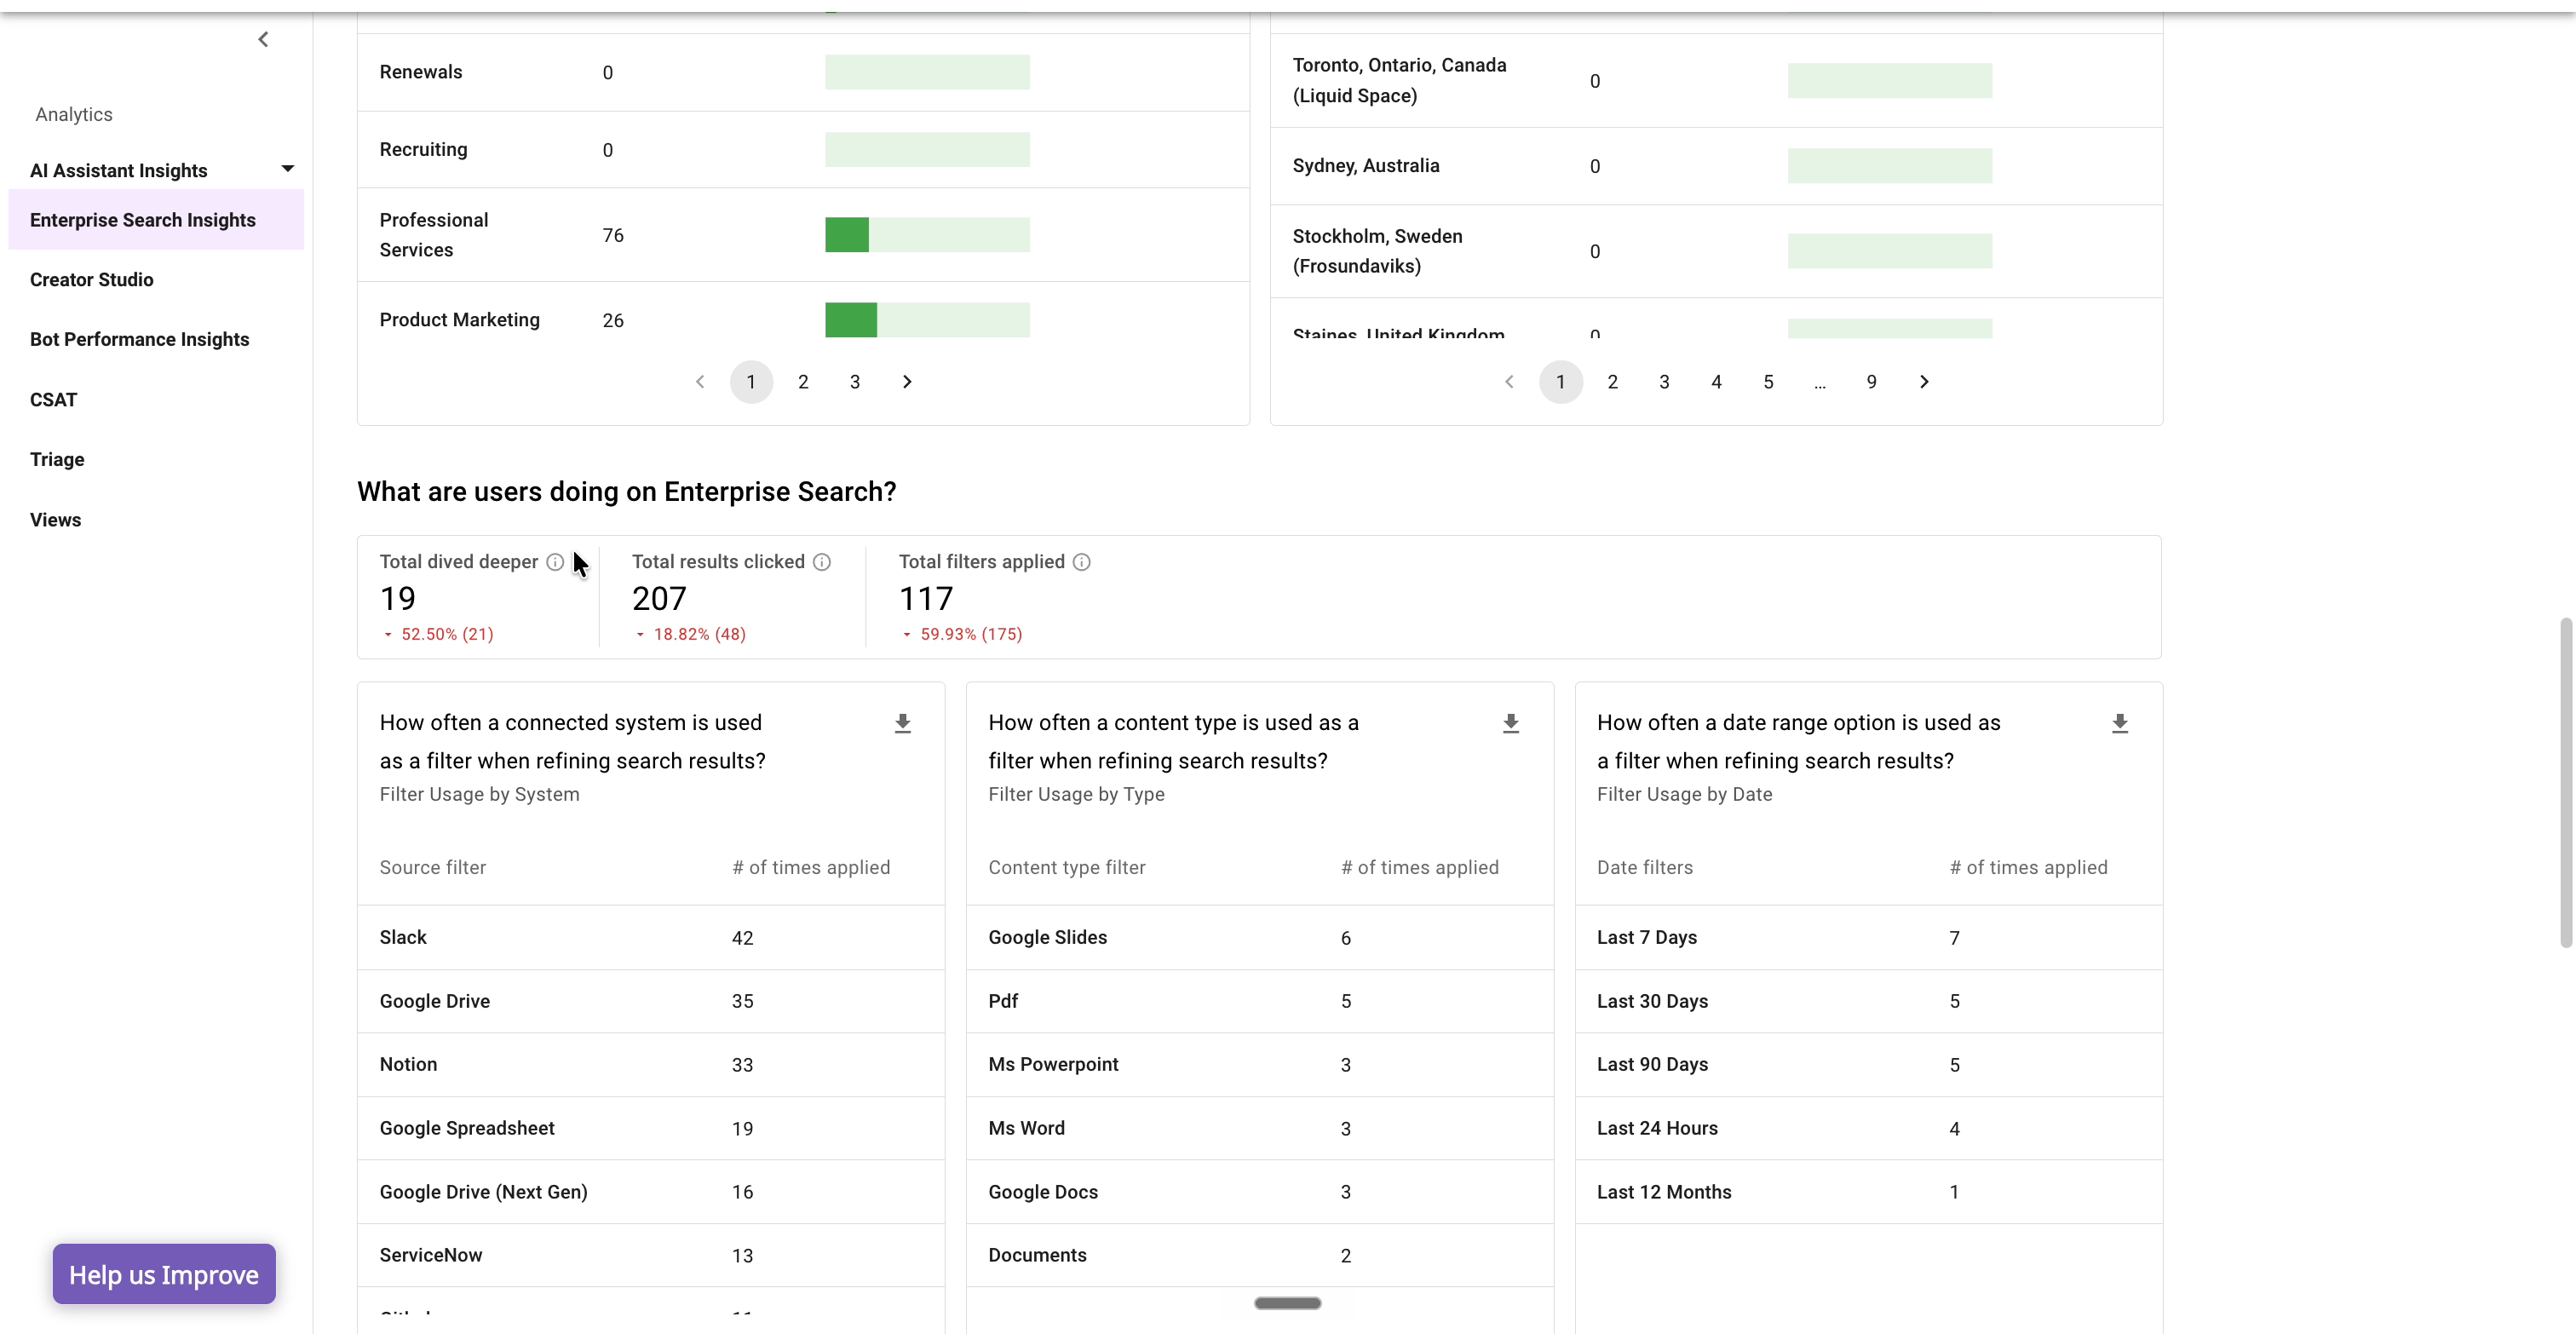
What are users doing on Enterprise Search?
This section captures how users engage with results, with three stat cards:
- Total dived deeper — how often users moved from search into AI Assistant mode.
- Total results clicked — how often users opened a result.
- Total filters applied — how often users refined a search with a filter.
It then breaks filter usage down across three widgets, each showing the number of times each filter value was applied:
- How often a connected system is used as a filter when refining search results? — Filter usage by system (for example, Slack, Google Drive, Notion). Frequently used system filters can indicate a connector worth expanding.
- How often a content type is used as a filter when refining search results? — Filter usage by type (for example, Google Slides, PDF, MS Word).
- How often a date range option is used as a filter when refining search results? — Filter usage by date (for example, Last 7 days, Last 30 days). Heavy use of date filters can signal that outdated content is surfacing.
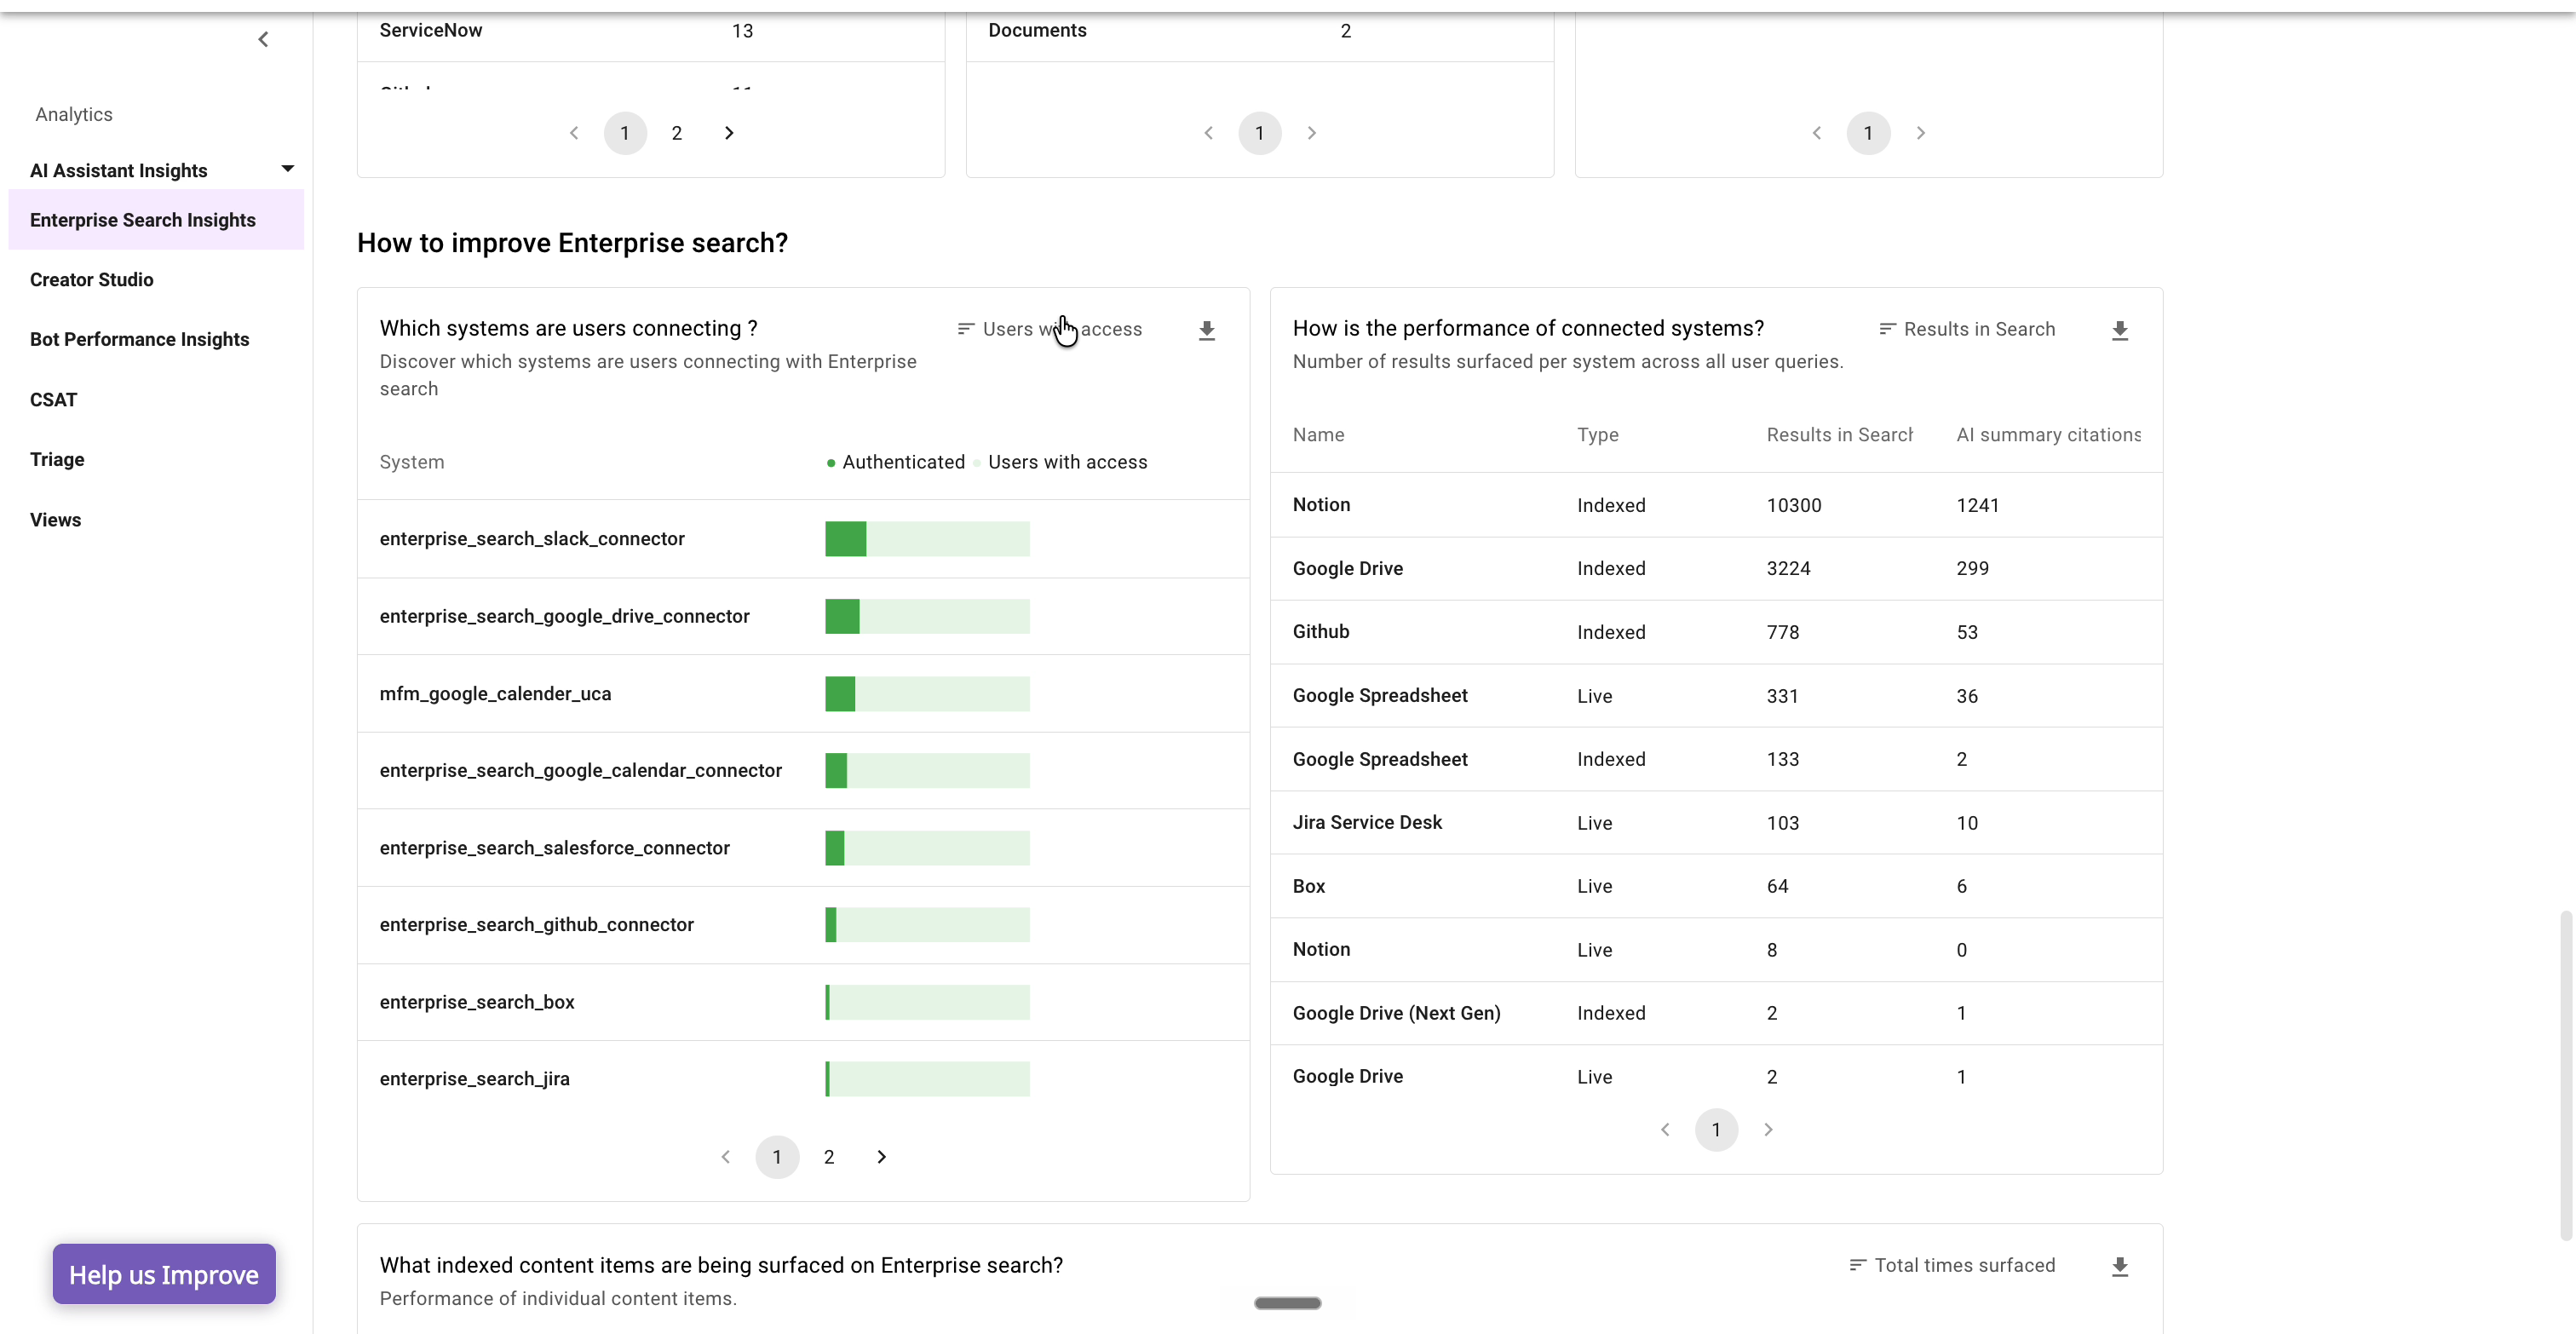
How to improve Enterprise Search?
This section surfaces the levers that improve search quality — system connectivity and content performance.
- Which systems are users connecting? — a table of systems users have authenticated against, alongside users with access. Comparing the two reveals gaps where a system is available but users have not yet connected to it.
- How is the performance of connected systems? — each connected system with its type (Live or Indexed), results in search (how often it returned results), and AI summary citations (how often its content was cited in an AI summary). This shows which systems are actually pulling their weight.
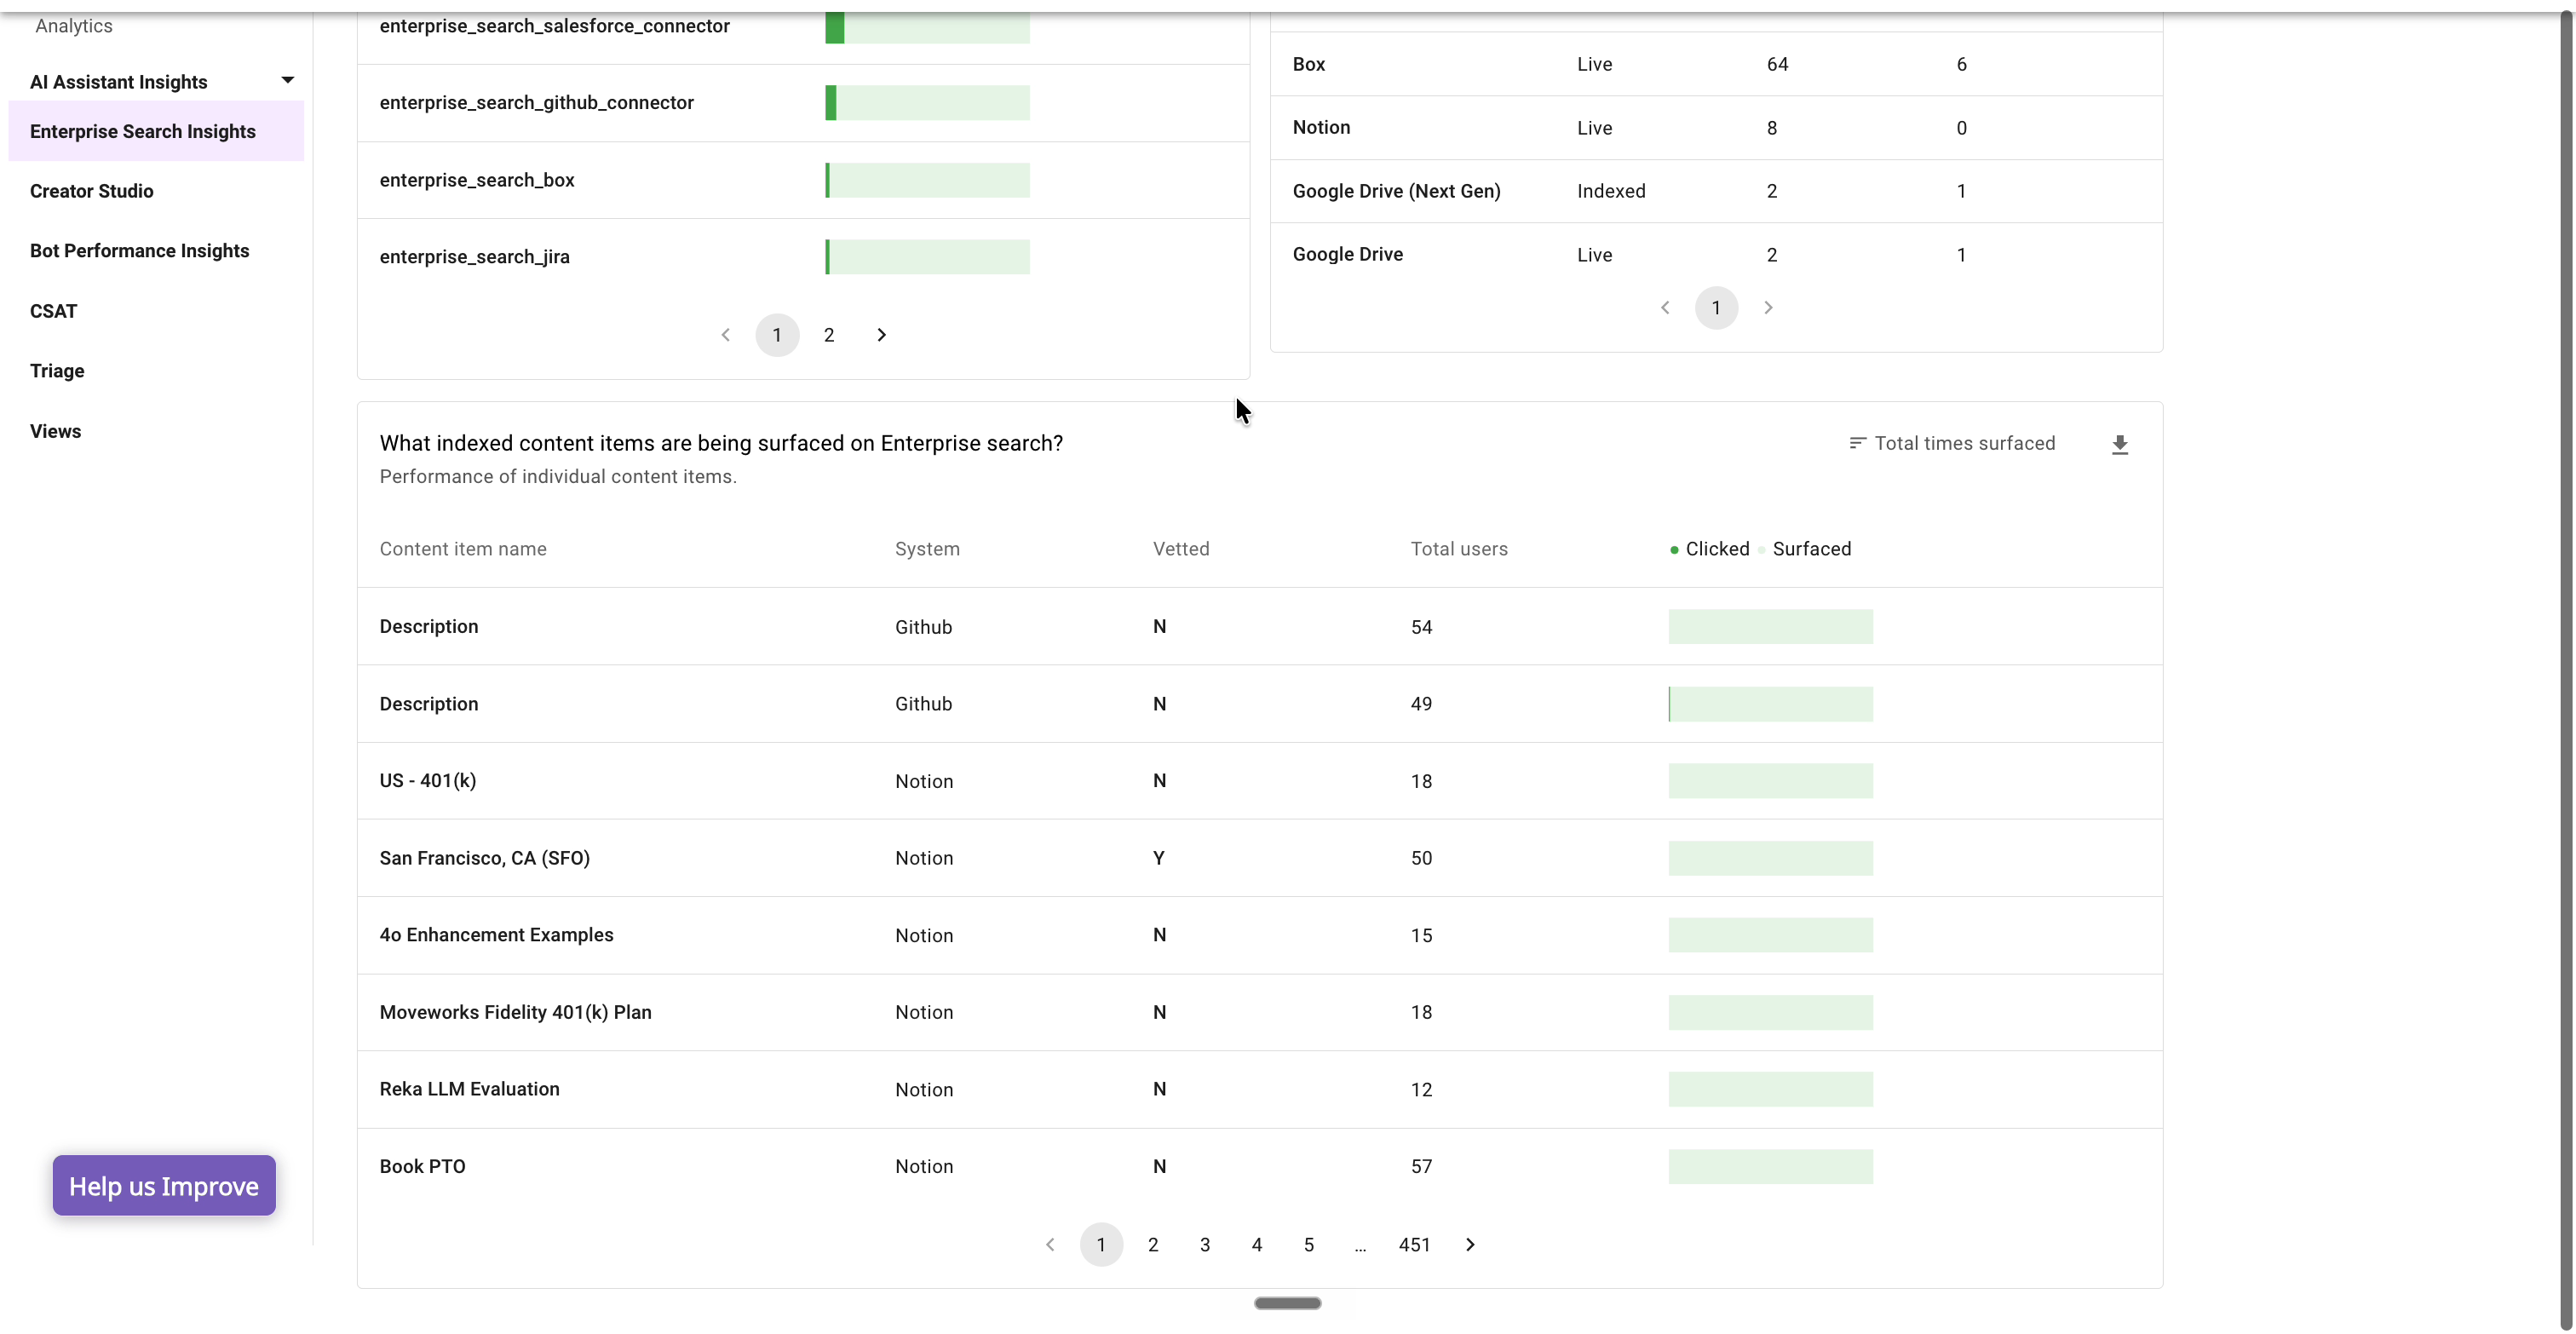
What indexed content items are being surfaced on Enterprise Search?
A table showing the performance of individual content items: content item name, system, vetted (Y/N), total users, and how often the item was clicked versus surfaced. This helps knowledge managers see which content is consumed, which is surfaced but ignored, and where to focus content updates.
What are key questions I can answer using this report?
Is Enterprise Search adoption growing, and where?
Use the active-users and search-volume trends together with the adoption deep dive (by department and location) to see whether usage is growing and which segments drive it or lag behind. The users-with-access columns show adoption relative to the eligible population.
Are users finding and engaging with results?
Use Total results clicked and Total dived deeper, plus the indexed-content performance table, to see whether surfaced results are being opened — and where content is surfaced often but rarely clicked.
How are users refining their searches?
Use the filter-usage widgets (by system, content type, and date range) to understand how users narrow results, and to spot signals such as a system filter used so often it warrants connector expansion, or heavy date filtering that suggests stale content.
Which connectors should I expand or add?
Use Which systems are users connecting? and How is the performance of connected systems? to identify high-value sources to scale and gaps where users have not authenticated to a connected system.
Troubleshooting and FAQs
What is the data refresh policy on this report?
Enterprise Search data is processed on a daily basis. Demographic data such as department and location is fetched from the user identity ingestion process, which runs approximately every 4–6 hours (the identity ingestion schedule can be configured differently for your organization).
Why is this report not visible to some users?
Ensure the user has the “Bot analytics admin” or “Bot analytics viewer” role for the analytics application. You can grant the required role using the RBAC tool.
Why is the report taking a long time to load?
Load time depends on the selected time interval. If you see consistently long load times or failures, please reach out to the Moveworks support team.
Why do search metrics differ from AI Assistant Insights?
Search Insights and AI Assistant Insights measure two different surfaces. A search in Enterprise Search is a single query with a set of results, while an AI Assistant interaction is a multi-turn conversation. The two reports are intentionally kept separate; where a user moves from search into Assistant via dive deeper, that handoff connects the two surfaces.