For AI agents: a documentation index is available at the root level at /llms.txt and /llms-full.txt. Append /llms.txt to any URL for a page-level index, or .md for the markdown version of any page.
Logo
DeveloperAcademyCommunityStatus
  • Getting Started
    • Welcome to Moveworks
    • Roadmap & Release Notes
    • Moveworks Best Practices
    • Labs
    • Professional Services
    • Support
  • AI Assistant
    • AI Assistant Overview
    • Capabilities
    • Web Experiences
    • Analytics & Performance
      • Configure Analytics and Data
      • AI Assistant Insights
        • CSAT Analytics
        • Channel Resolver Analytics
        • User Insights
        • Knowledge Insights
        • Ticketing Insights
        • Form Insights
        • Approval Insights
        • Access Software Insights
        • Access Group Insights
        • Access Account Insights
        • Ticket Interception Analytics
        • Raw interactions
        • Triage Insights
      • Customer Satisfaction Survey (CSAT)
      • Data API
      • Submitting an Analytic Data Request
      • Analytics Support Guide
      • Custom Views & Data governance — “How to?” Guide
      • Governing interactions - Best practices
      • Enterprise search insights
  • Enterprise Search
    • Overview
    • Search Connectors
    • Agentic RAG Overview
    • Content Ingestion Platform
    • How Search Works
    • Monitor Indexed Content
    • Vetted Content
    • Permissions
  • Productivity Boost
    • Overview
    • Configure Productivity Boost
    • Quick GPT
    • Calendar Management
    • Brief Me
DeveloperAcademyCommunityStatus
On this page
  • Overview
AI AssistantAnalytics & PerformanceAI Assistant Insights

CSAT Analytics

||View as Markdown|
Was this page helpful?
Edit this page
Previous

Channel Resolver Analytics

Next
Built with

Overview

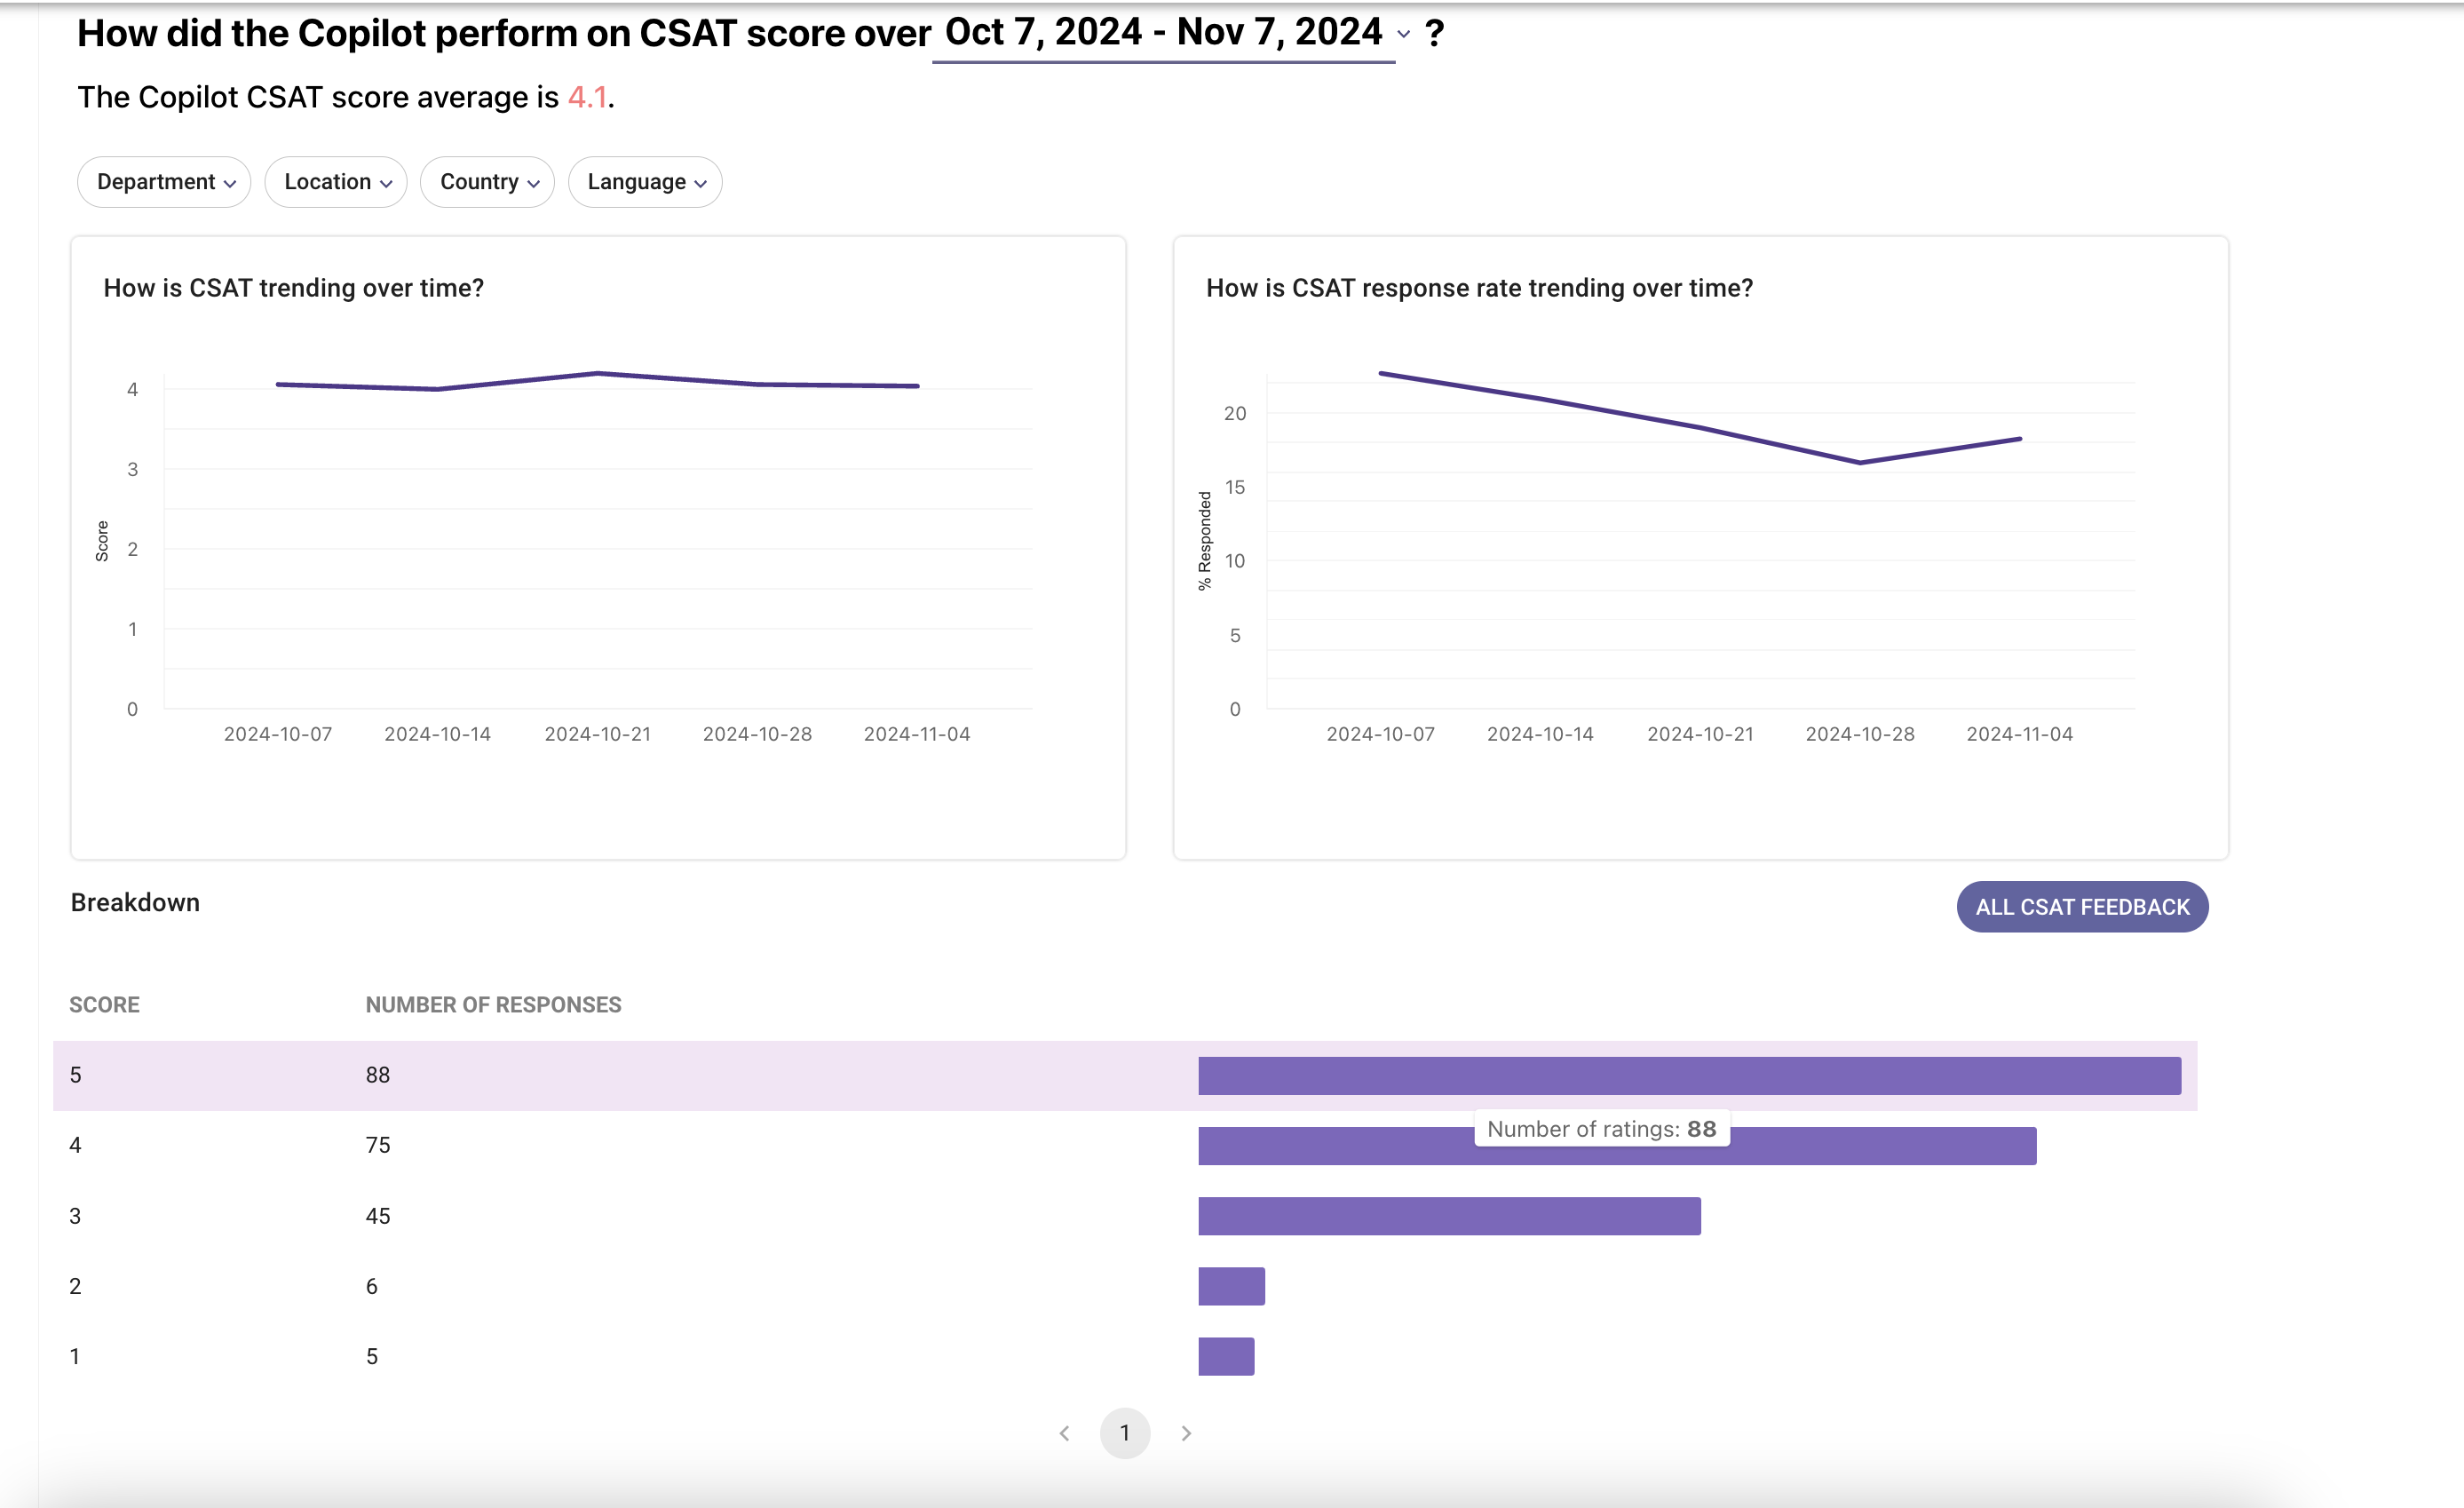
The CSAT dashboard can be found under AI Assistant Insights in your analytics app and offers an insightful overview of user satisfaction concerning the Moveworks AI Assistant and its overall performance within your organization. It features advanced filtering options, including user department and location, allowing for a comprehensive analysis of the feedback data.

The date range can be changed at the very top of the screen by clicking on the underlined dates.

At the top there are two graphs that display how the score and response rate are varying over time. Hovering on any data point will allow you to view accurate information.

The score breakdown section displays the number of responses for each rating point in the defined time range. Clicking on any of these will open a new tab to the right which contains detailed information regarding the date on which the survey was taken and any feedback that the user has provided.

An aggregated report of all the information can be viewed by clicking on the “ALL CSAT FEEDBACK” button.

🎥 See a walkthrough - Watch this Academy video on CSAT Insights