
Data Crawling View
Data Crawling View is currently in Beta
Data Crawling View is currently in Beta and is an initial step toward providing customer admins visibility into the crawling health of their configured systems.
As this is a Beta feature, you might encounter some unexpected behavior. We encourage you to share your feedback on the community so we can continue to improve it over time.
Resource Lifecycle
Moveworks connects to your enterprise systems to power key native capabilities in the AI Assistant, such as Enterprise Search, Ticketing, Forms, Group Access, Software Access, and more. Based on the configured connectors and plugins, Moveworks fetches data including Knowledge articles, Files, Forms, Users, Groups, and Permissions.
Once fetched, this data goes through a series of processing and enrichment steps before being indexed and made available to users through the assistant.
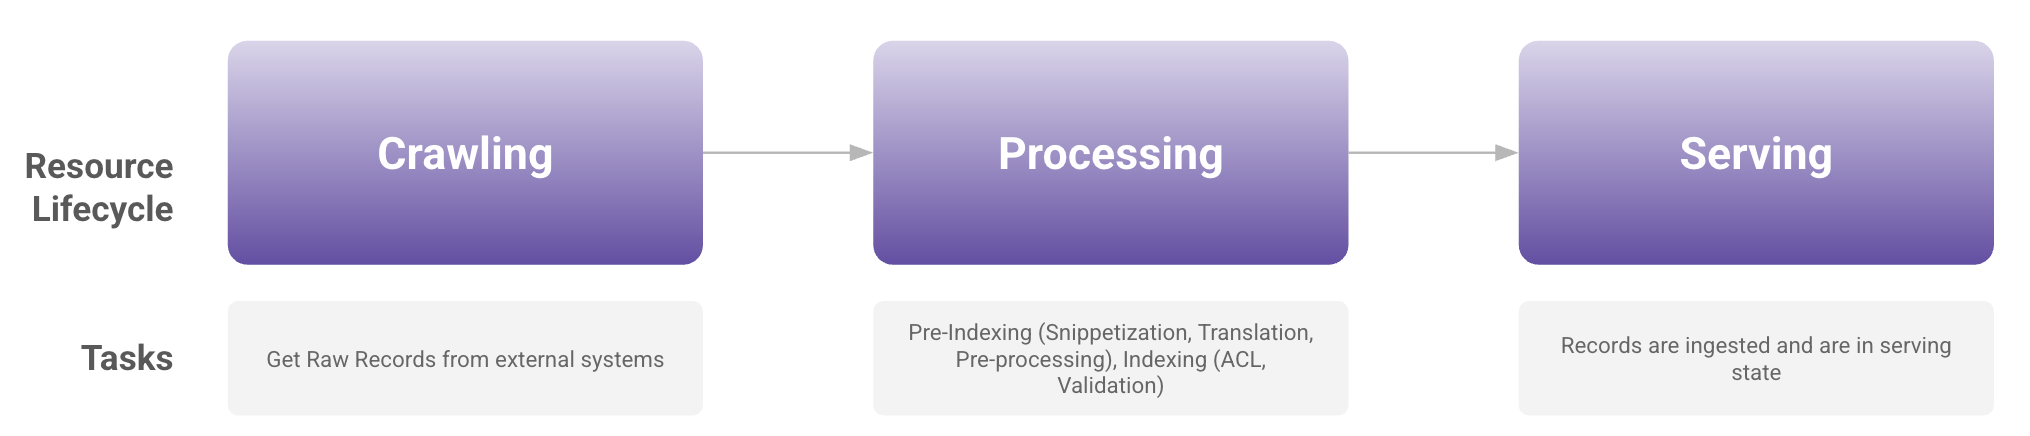
In summary, after a connector is set up and a resource (such as Knowledge, Files, or Forms) is configured, the data flows through the following stages:
What is Data Crawling View?
Data Crawling View helps Moveworks admins investigate how resources are fetched from connected systems. The available details depend on the section where the resource appears.
Data Crawling View and the indexed resource screens measure different stages of ingestion. Crawl-run logs show records fetched from a source, while connectors under Content (new architecture) show failed API requests. The Indexed Content, Users, and Forms screens show records after processing and indexing. These counts should not be compared directly.
For resources with a crawl-run view, including connectors listed under Content, Moveworks admins can:
- Monitor the health of configured enterprise systems
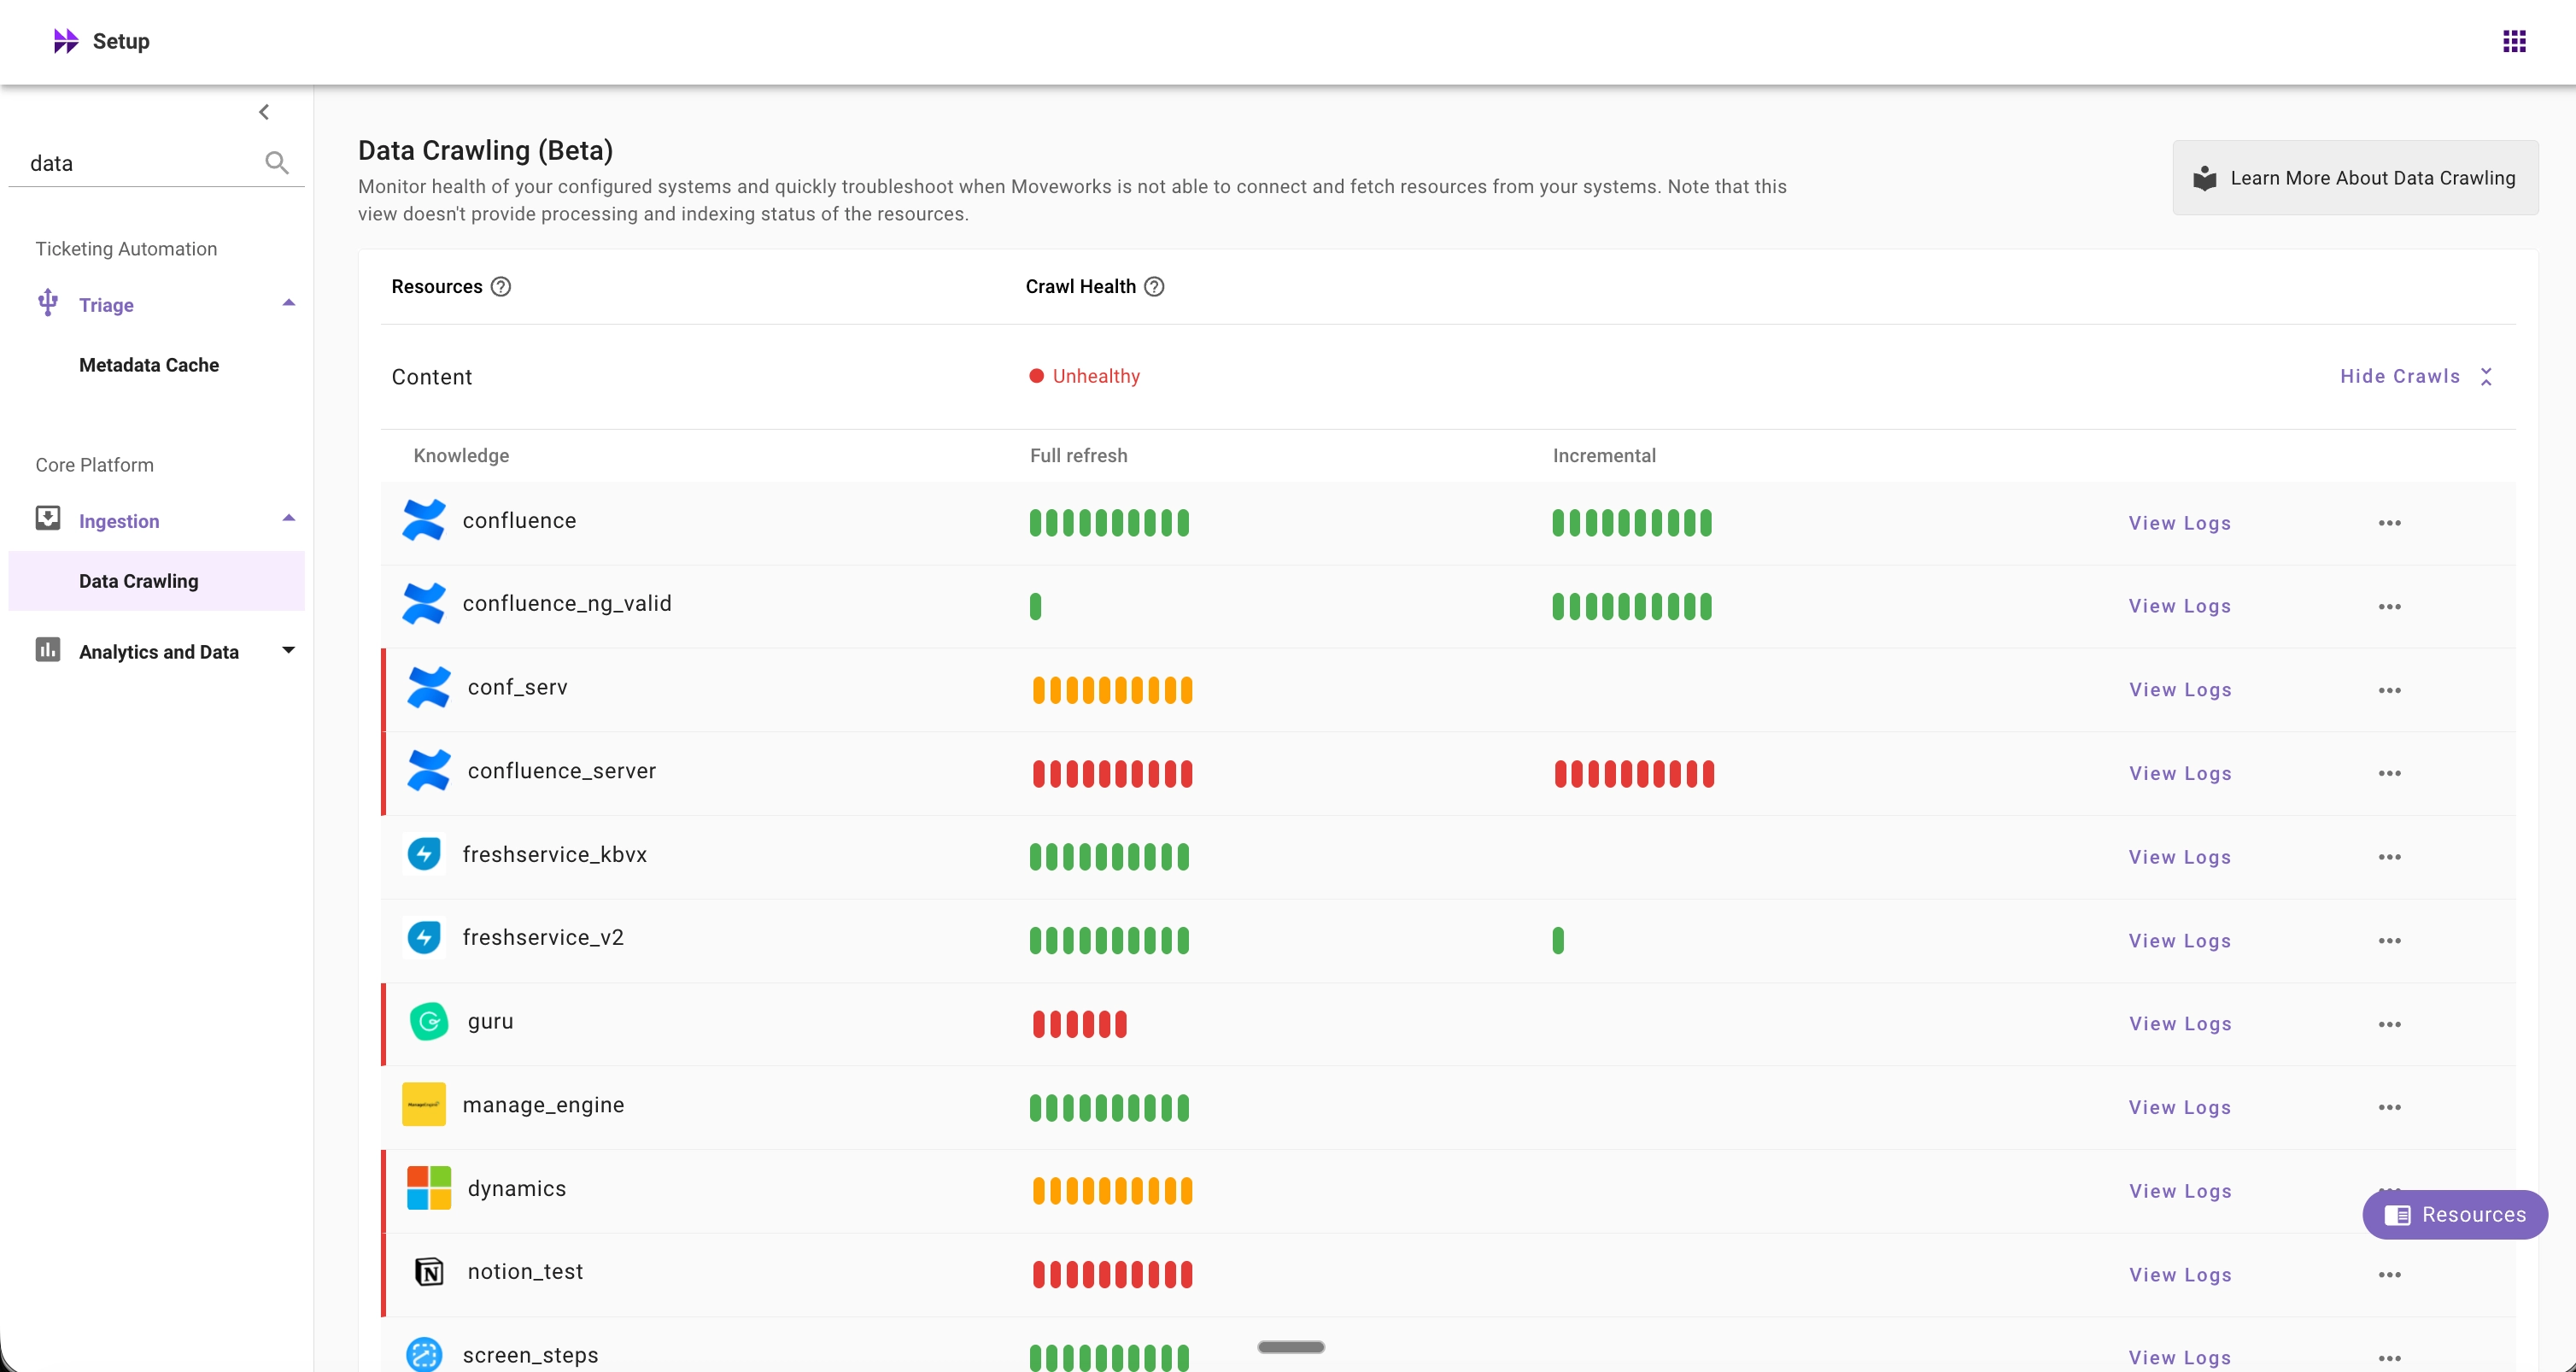
- View the status of the last 10 crawl runs (full and incremental)
- Access detailed logs for each crawl run, including:
- Successfully crawled records
- Failed API requests
- Error summaries for failed crawl runs
- Quickly navigate to the relevant connector or resource ingestion configuration
Connectors listed under Content (new architecture) provide direct access to failed API request details. Follow the instructions below for the section shown in your organization.
How to access Data Crawling Viewer?
- Log into Moveworks Setup
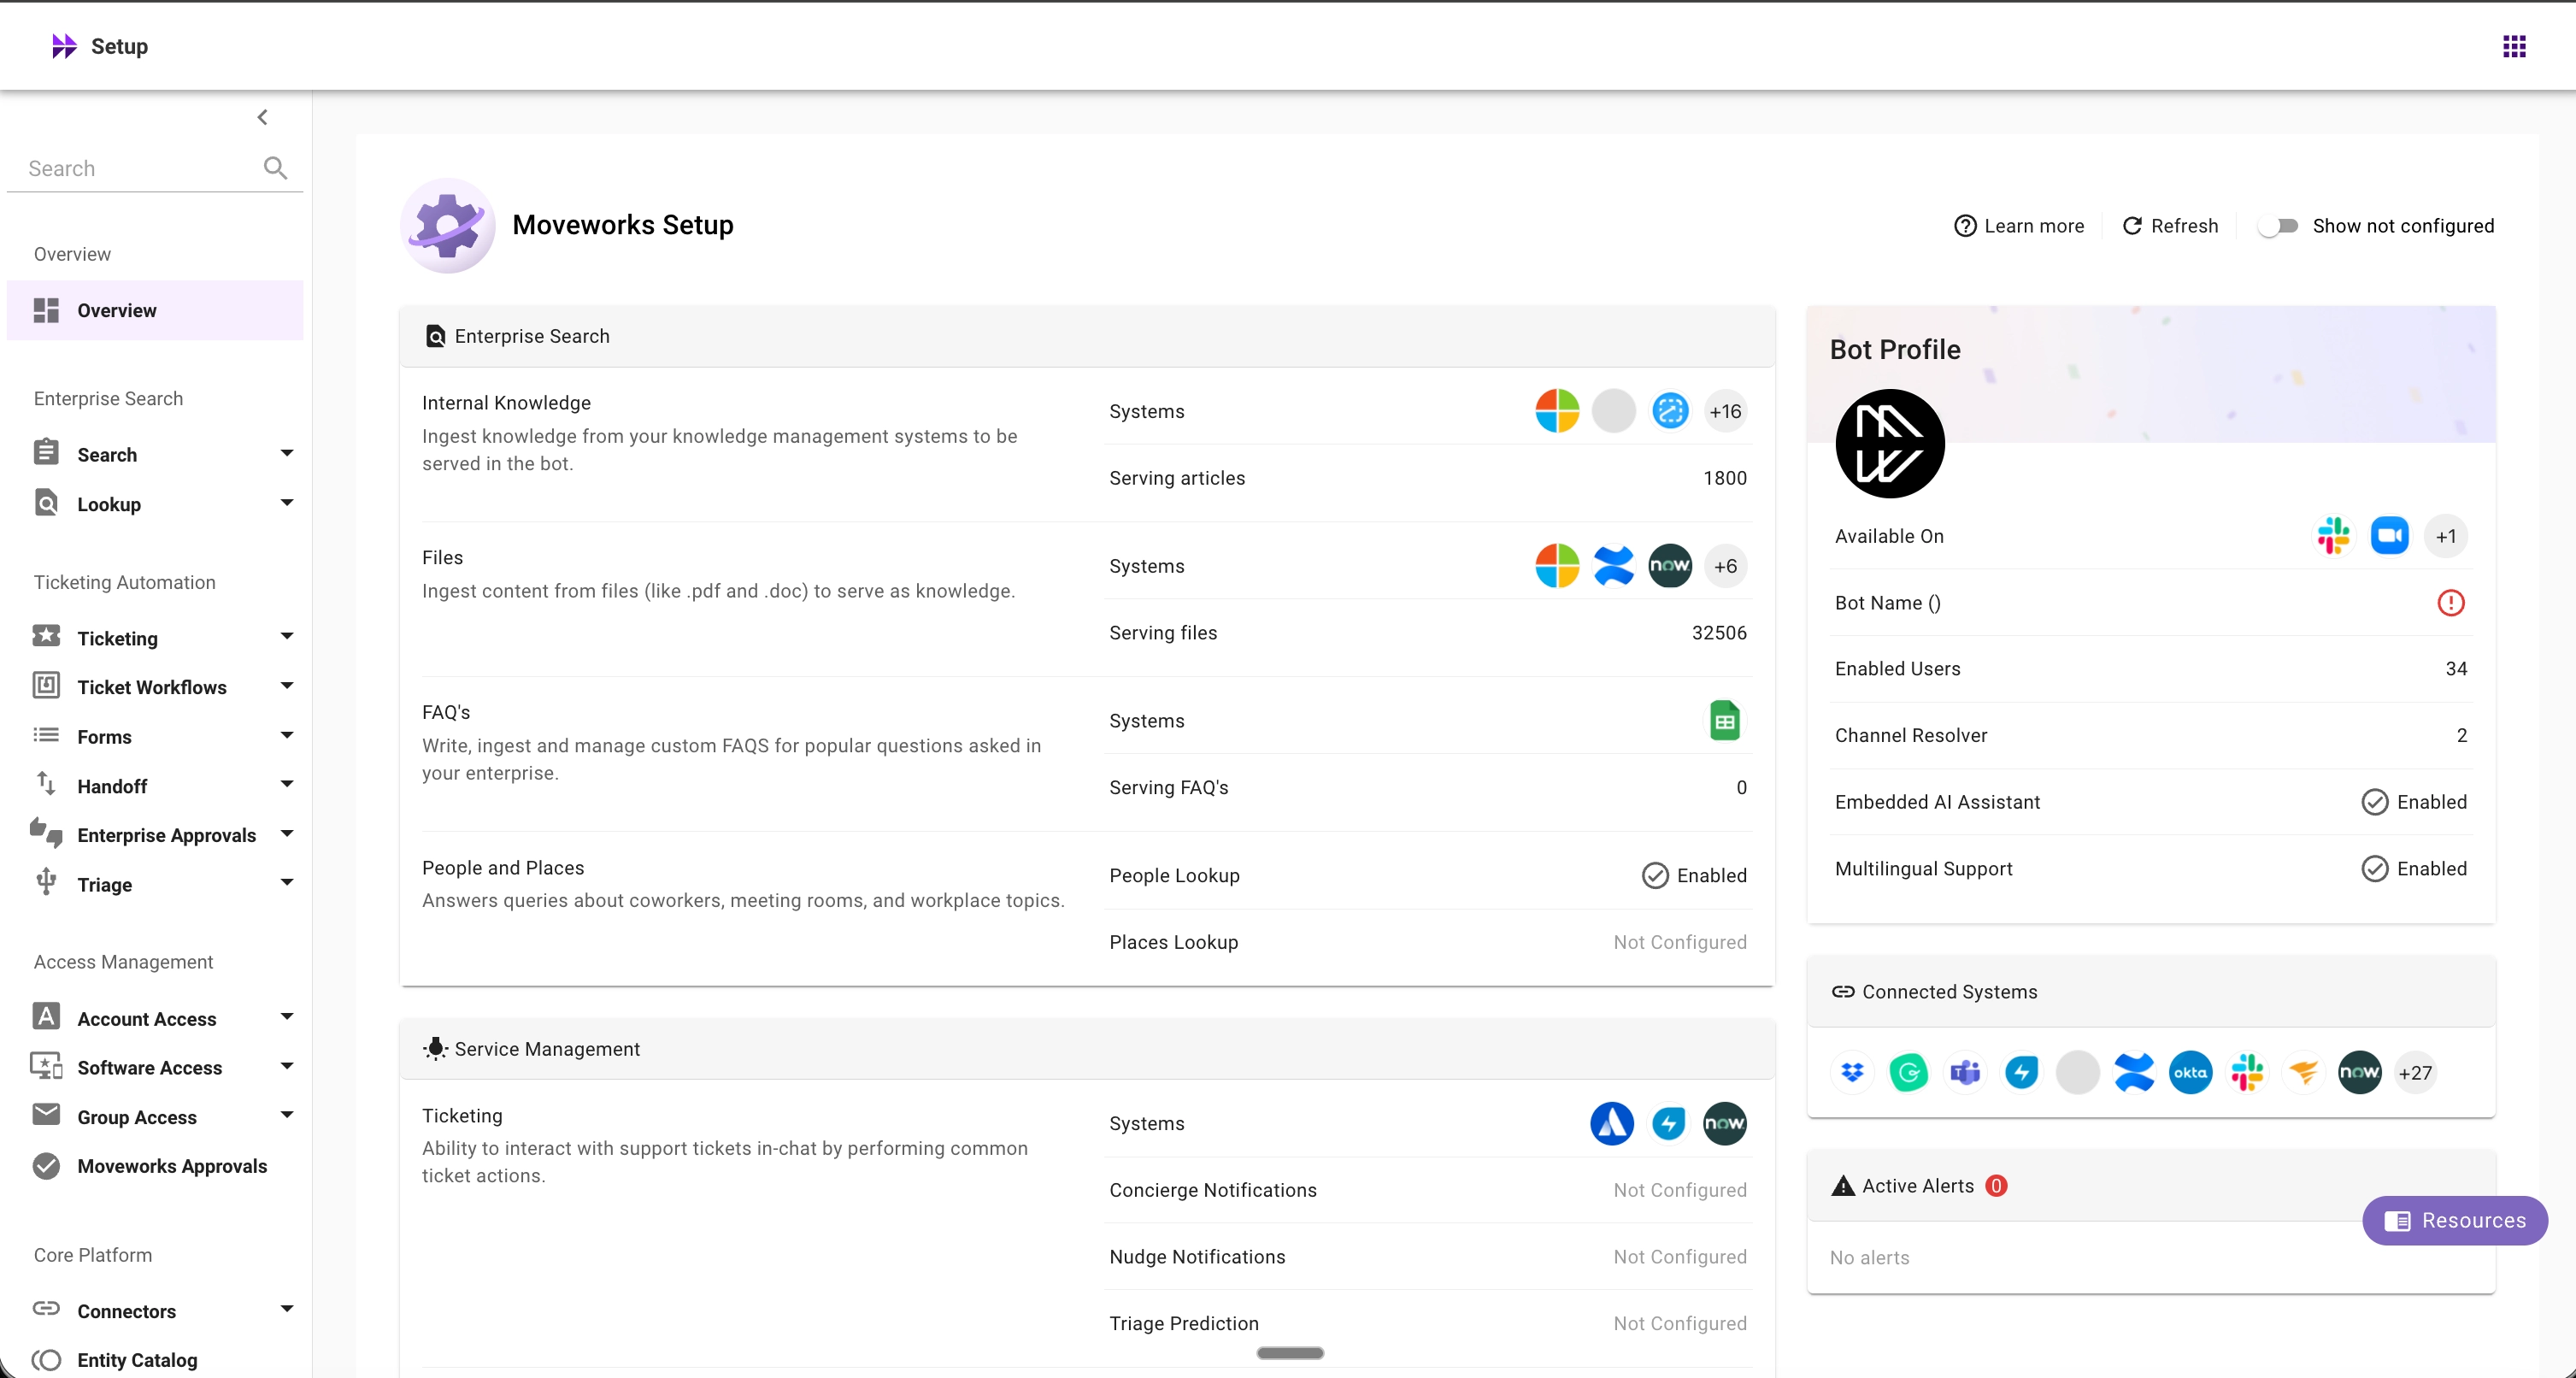
- Navigate to Core Platform → Data Ingestion → Data Crawling in the left navigation.
Choose the instructions that match your content connector
Content connectors appear automatically under Content (new architecture) as Moveworks switches them to the updated ingestion architecture for your organization. During this transition, some connectors can appear under Content and others under Content (new architecture). No migration or configuration action is required from you.
For migrated connectors, troubleshooting moves from opening an ingestion run to reviewing failed API requests directly. Moveworks is developing the Content Troubleshooting Hub to bring connector issues and individual record status together in one place. Until it is available, use the workflow below.
Content (new architecture) is available on the standalone Core Platform → Data Ingestion → Data Crawling page. The crawling views opened from Indexed Content → Internal Knowledge or Files do not show this section. Open the standalone page to troubleshoot migrated connectors, and continue using Indexed Content for individual record details.
Investigate failed requests under Content (new architecture)
-
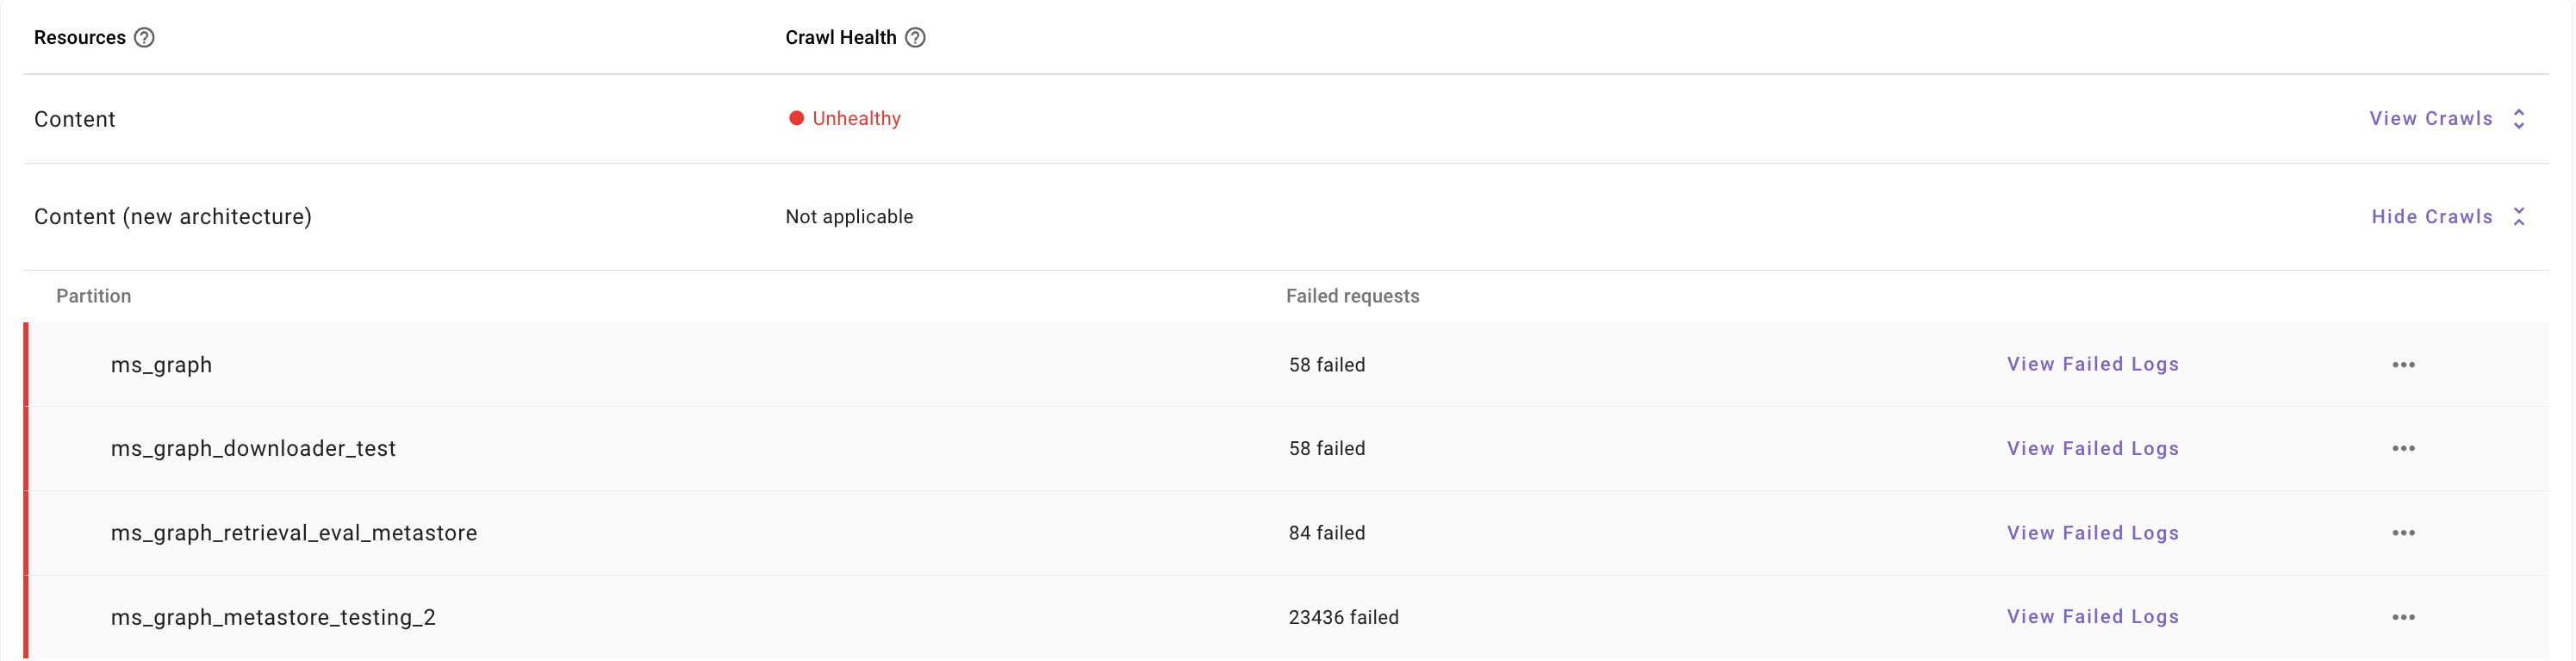
On the standalone Data Crawling page, expand Content (new architecture) by selecting View Crawls.
-
Locate the connector under the relevant resource group, such as Knowledge, Files, or Permissions. The Failed requests column shows the reported number of failed API requests for that row.
-
Select View Failed Logs to open Failed API Requests, which shows failed requests from the last 30 days.
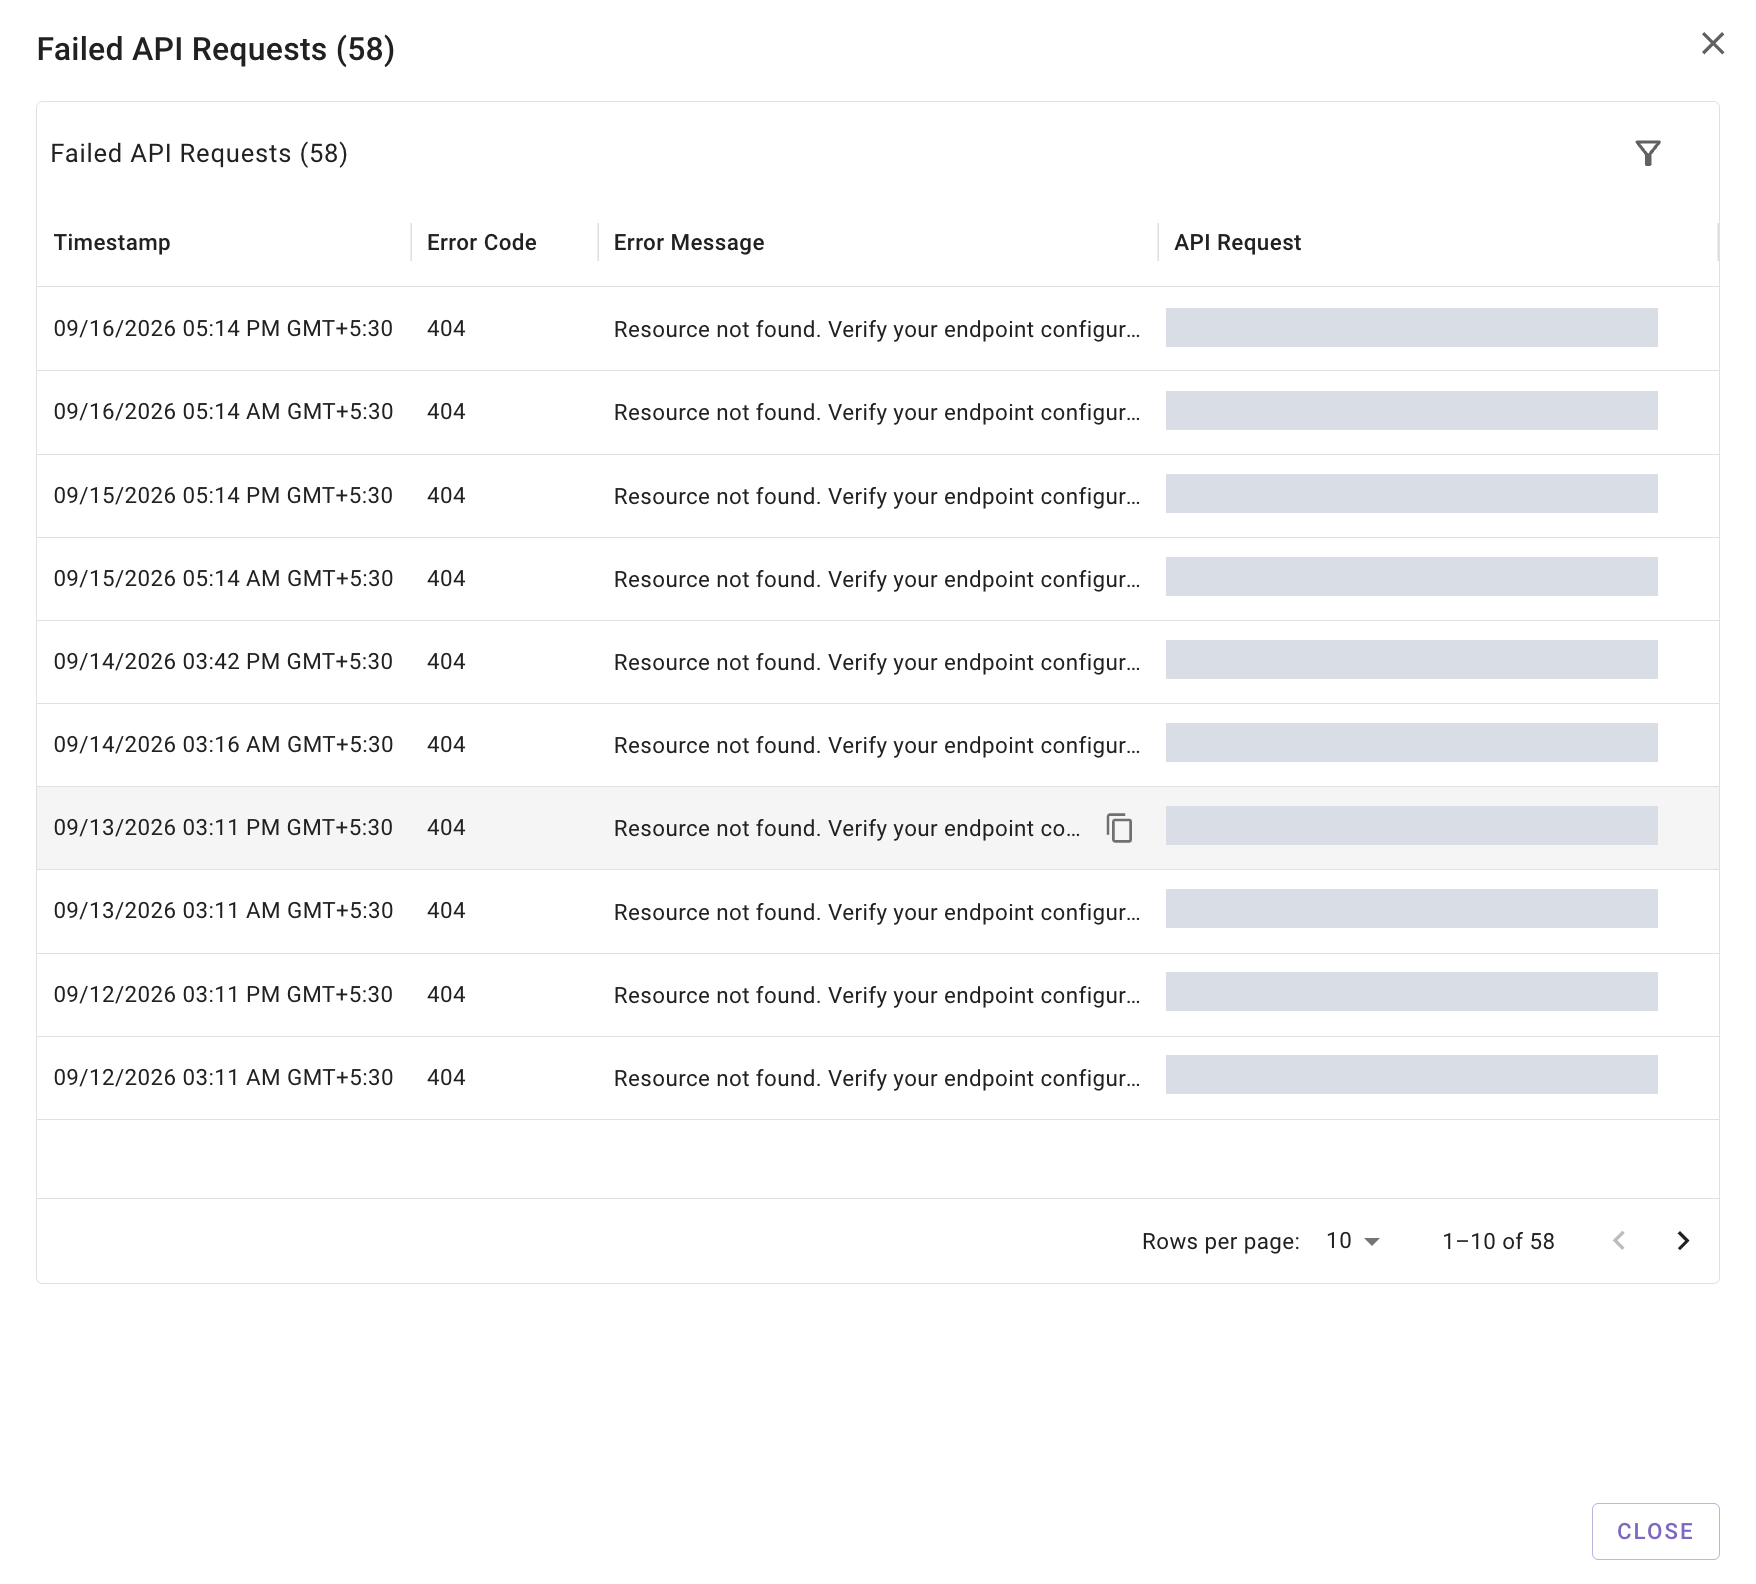
Request URLs are hidden in this example.
-
Review the request details in the table:
-
Use the filter control to narrow the table by Error Code. Use the pagination controls to inspect additional entries.
-
Review the error message and affected request with the administrator of the source system. If you need help, contact Moveworks Support with your organization, connector, affected resource or record, failure timestamp, and relevant request details.
The count represents failed API requests, not missing documents. Repeated requests to the same endpoint can appear as separate entries. Review the timestamps and request details to identify the failures relevant to your investigation.
Crawl Health: Not applicable means this section does not report an overall crawl-health status. Use View Failed Logs to review individual request failures. The label does not indicate an ingestion failure.
An empty failed-request list does not confirm that all content is up to date. If content is missing or outdated, open Search → Indexed Content and inspect the affected article or file’s record details. Contact Moveworks Support if the record details and failed-request logs do not explain the issue.
Data Crawling Viewer: Components & Definitions
The crawl-run instructions below apply to Content and other resources that display crawl runs. For connectors under Content (new architecture), use the failed-request workflow above.
Resources
Resources are types of data ingested into Moveworks from your external systems, representing categories like Content, Forms, FAQ and Users. The resource list can also include Content (new architecture) for connectors using the updated monitoring experience. The original resource categories are:
- Content
- Knowledge articles
- Files
- Permissions
- Groups (Knowledge and Files)
- Forms
- FAQs
- Users
- Ticketing
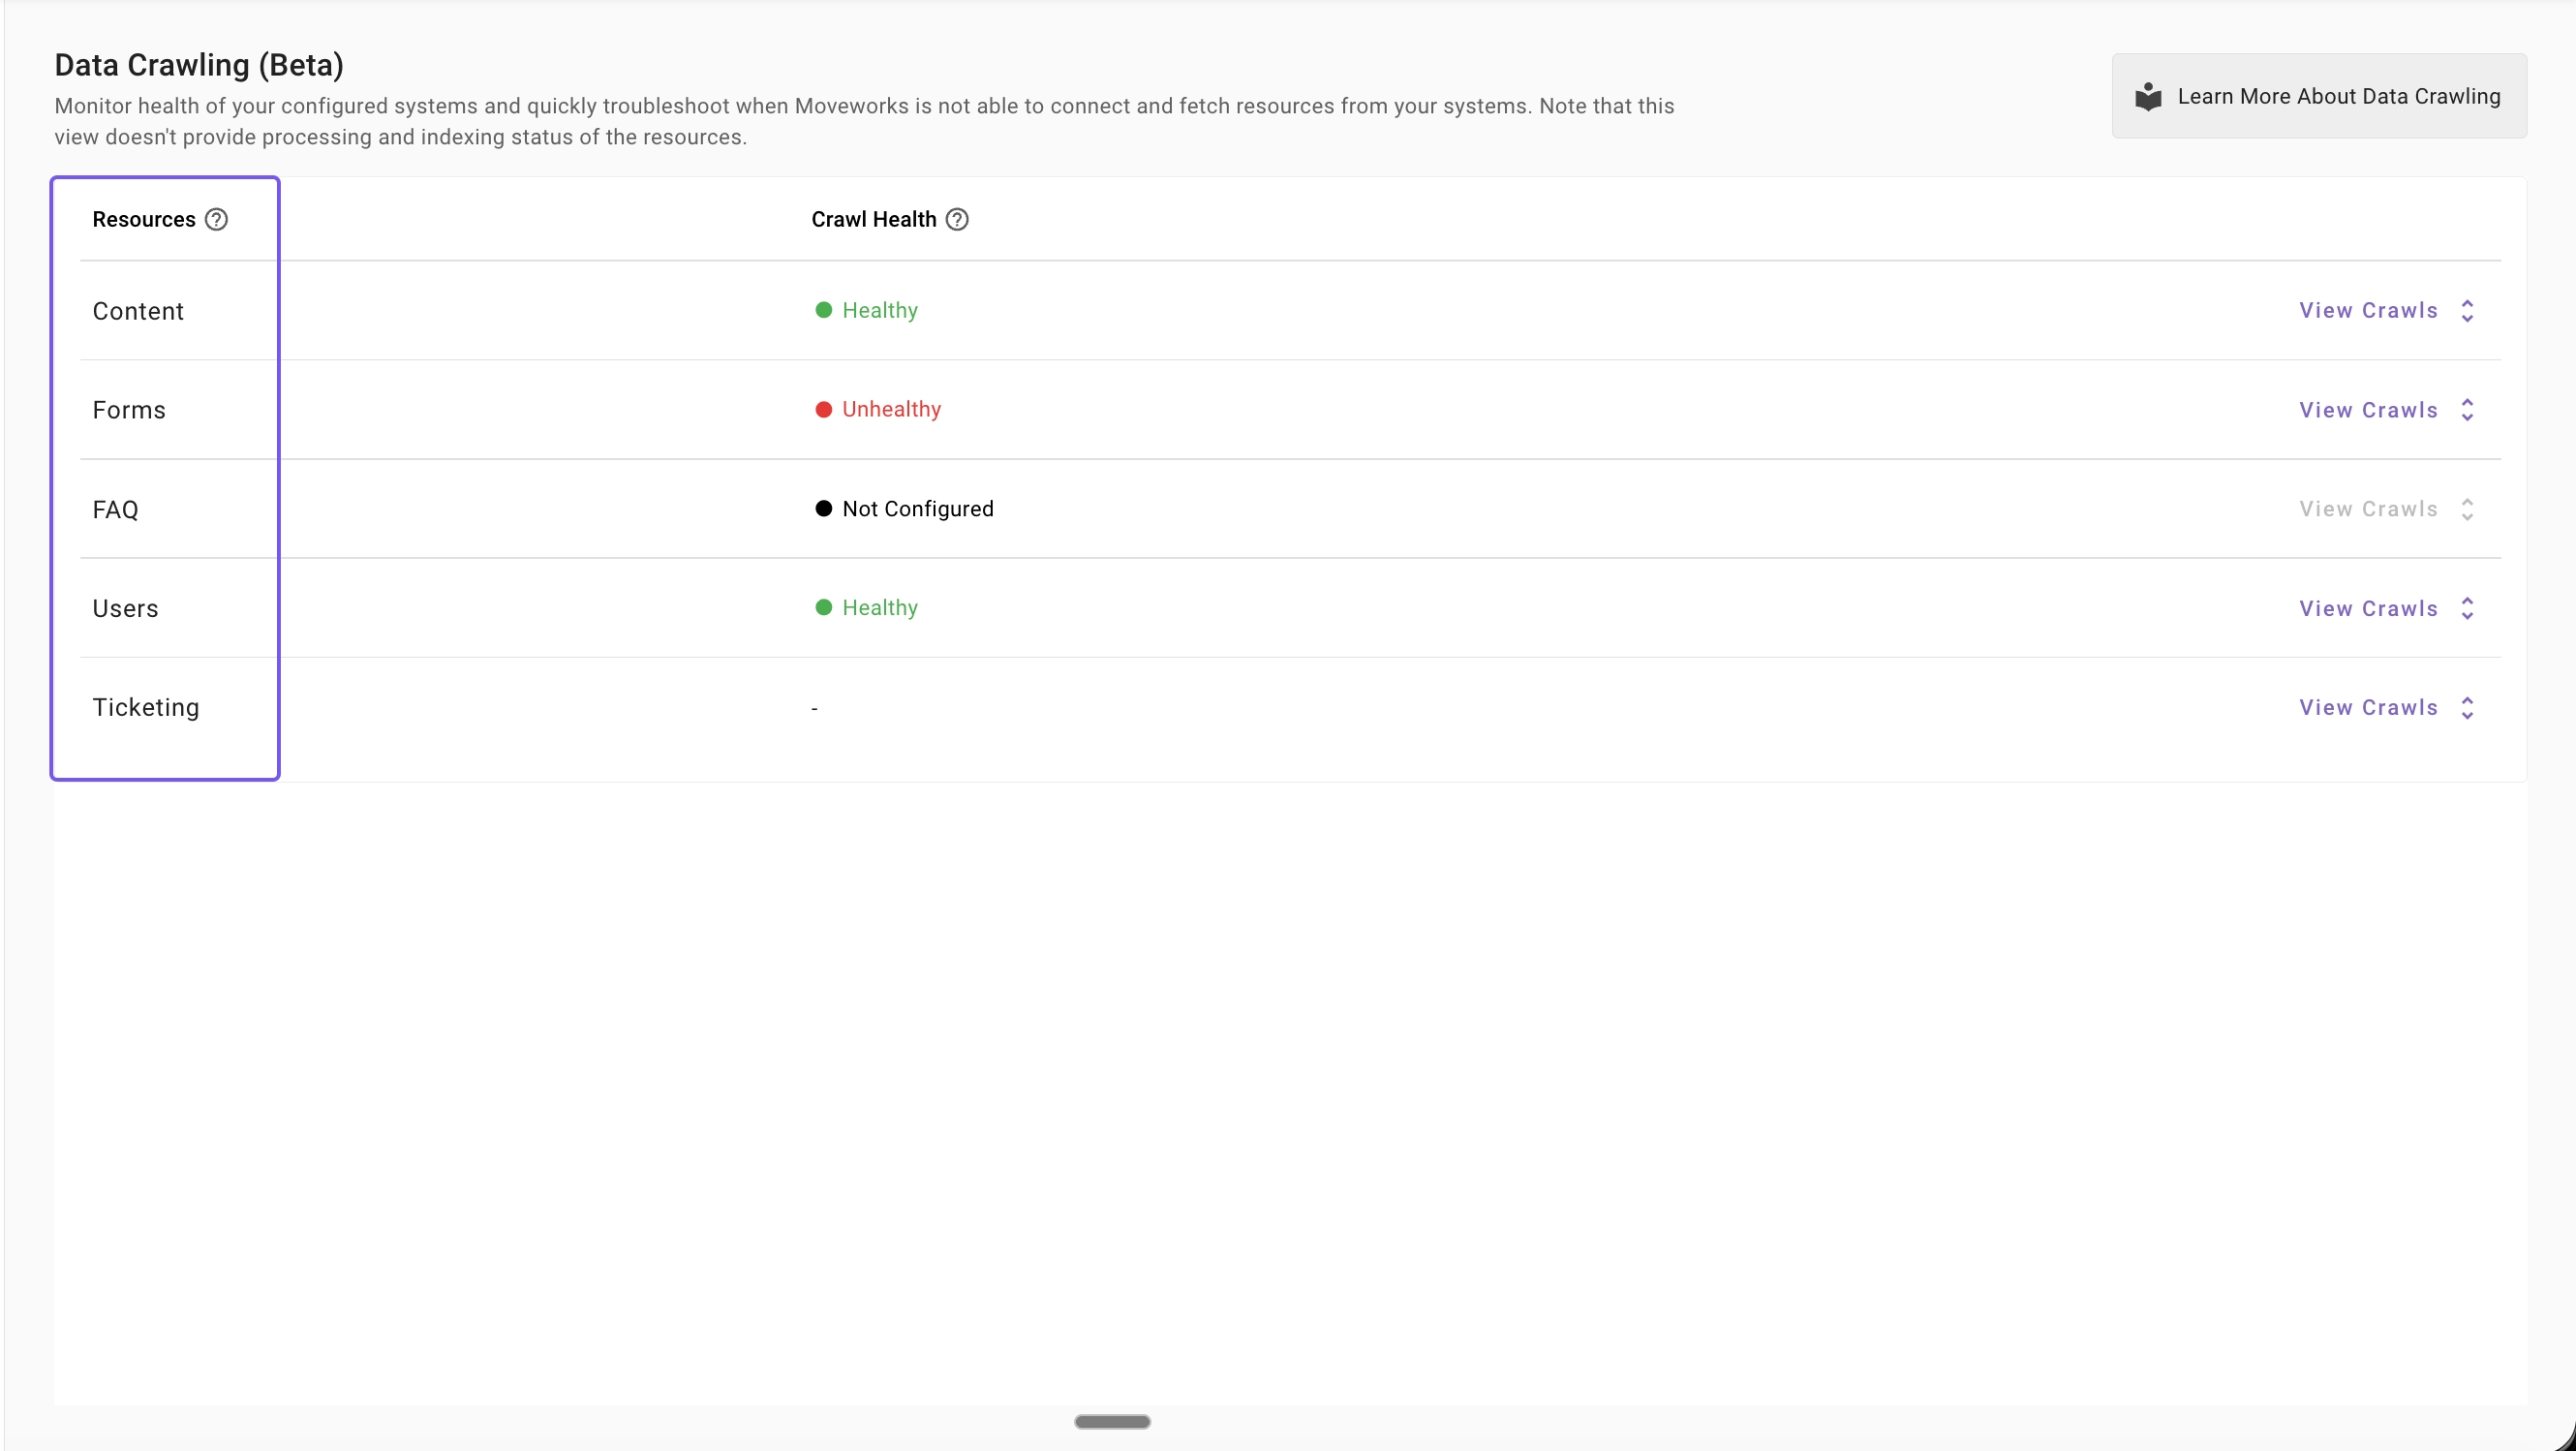
Note: For Groups, only configurations related to Content (Knowledge and Files) are currently supported. Crawl details for Access DL systems are not supported.
Crawl Health
Crawl Health indicates whether Moveworks is able to successfully fetch data for each resource based on the latest crawl runs. Below are the definitions of each health status:
- Healthy: All latest crawl runs for the resource succeeded
- Unhealthy: One or more latest runs for the resource failed
- Not configured: Configurations for this resource are not set up yet, so data is not being fetched
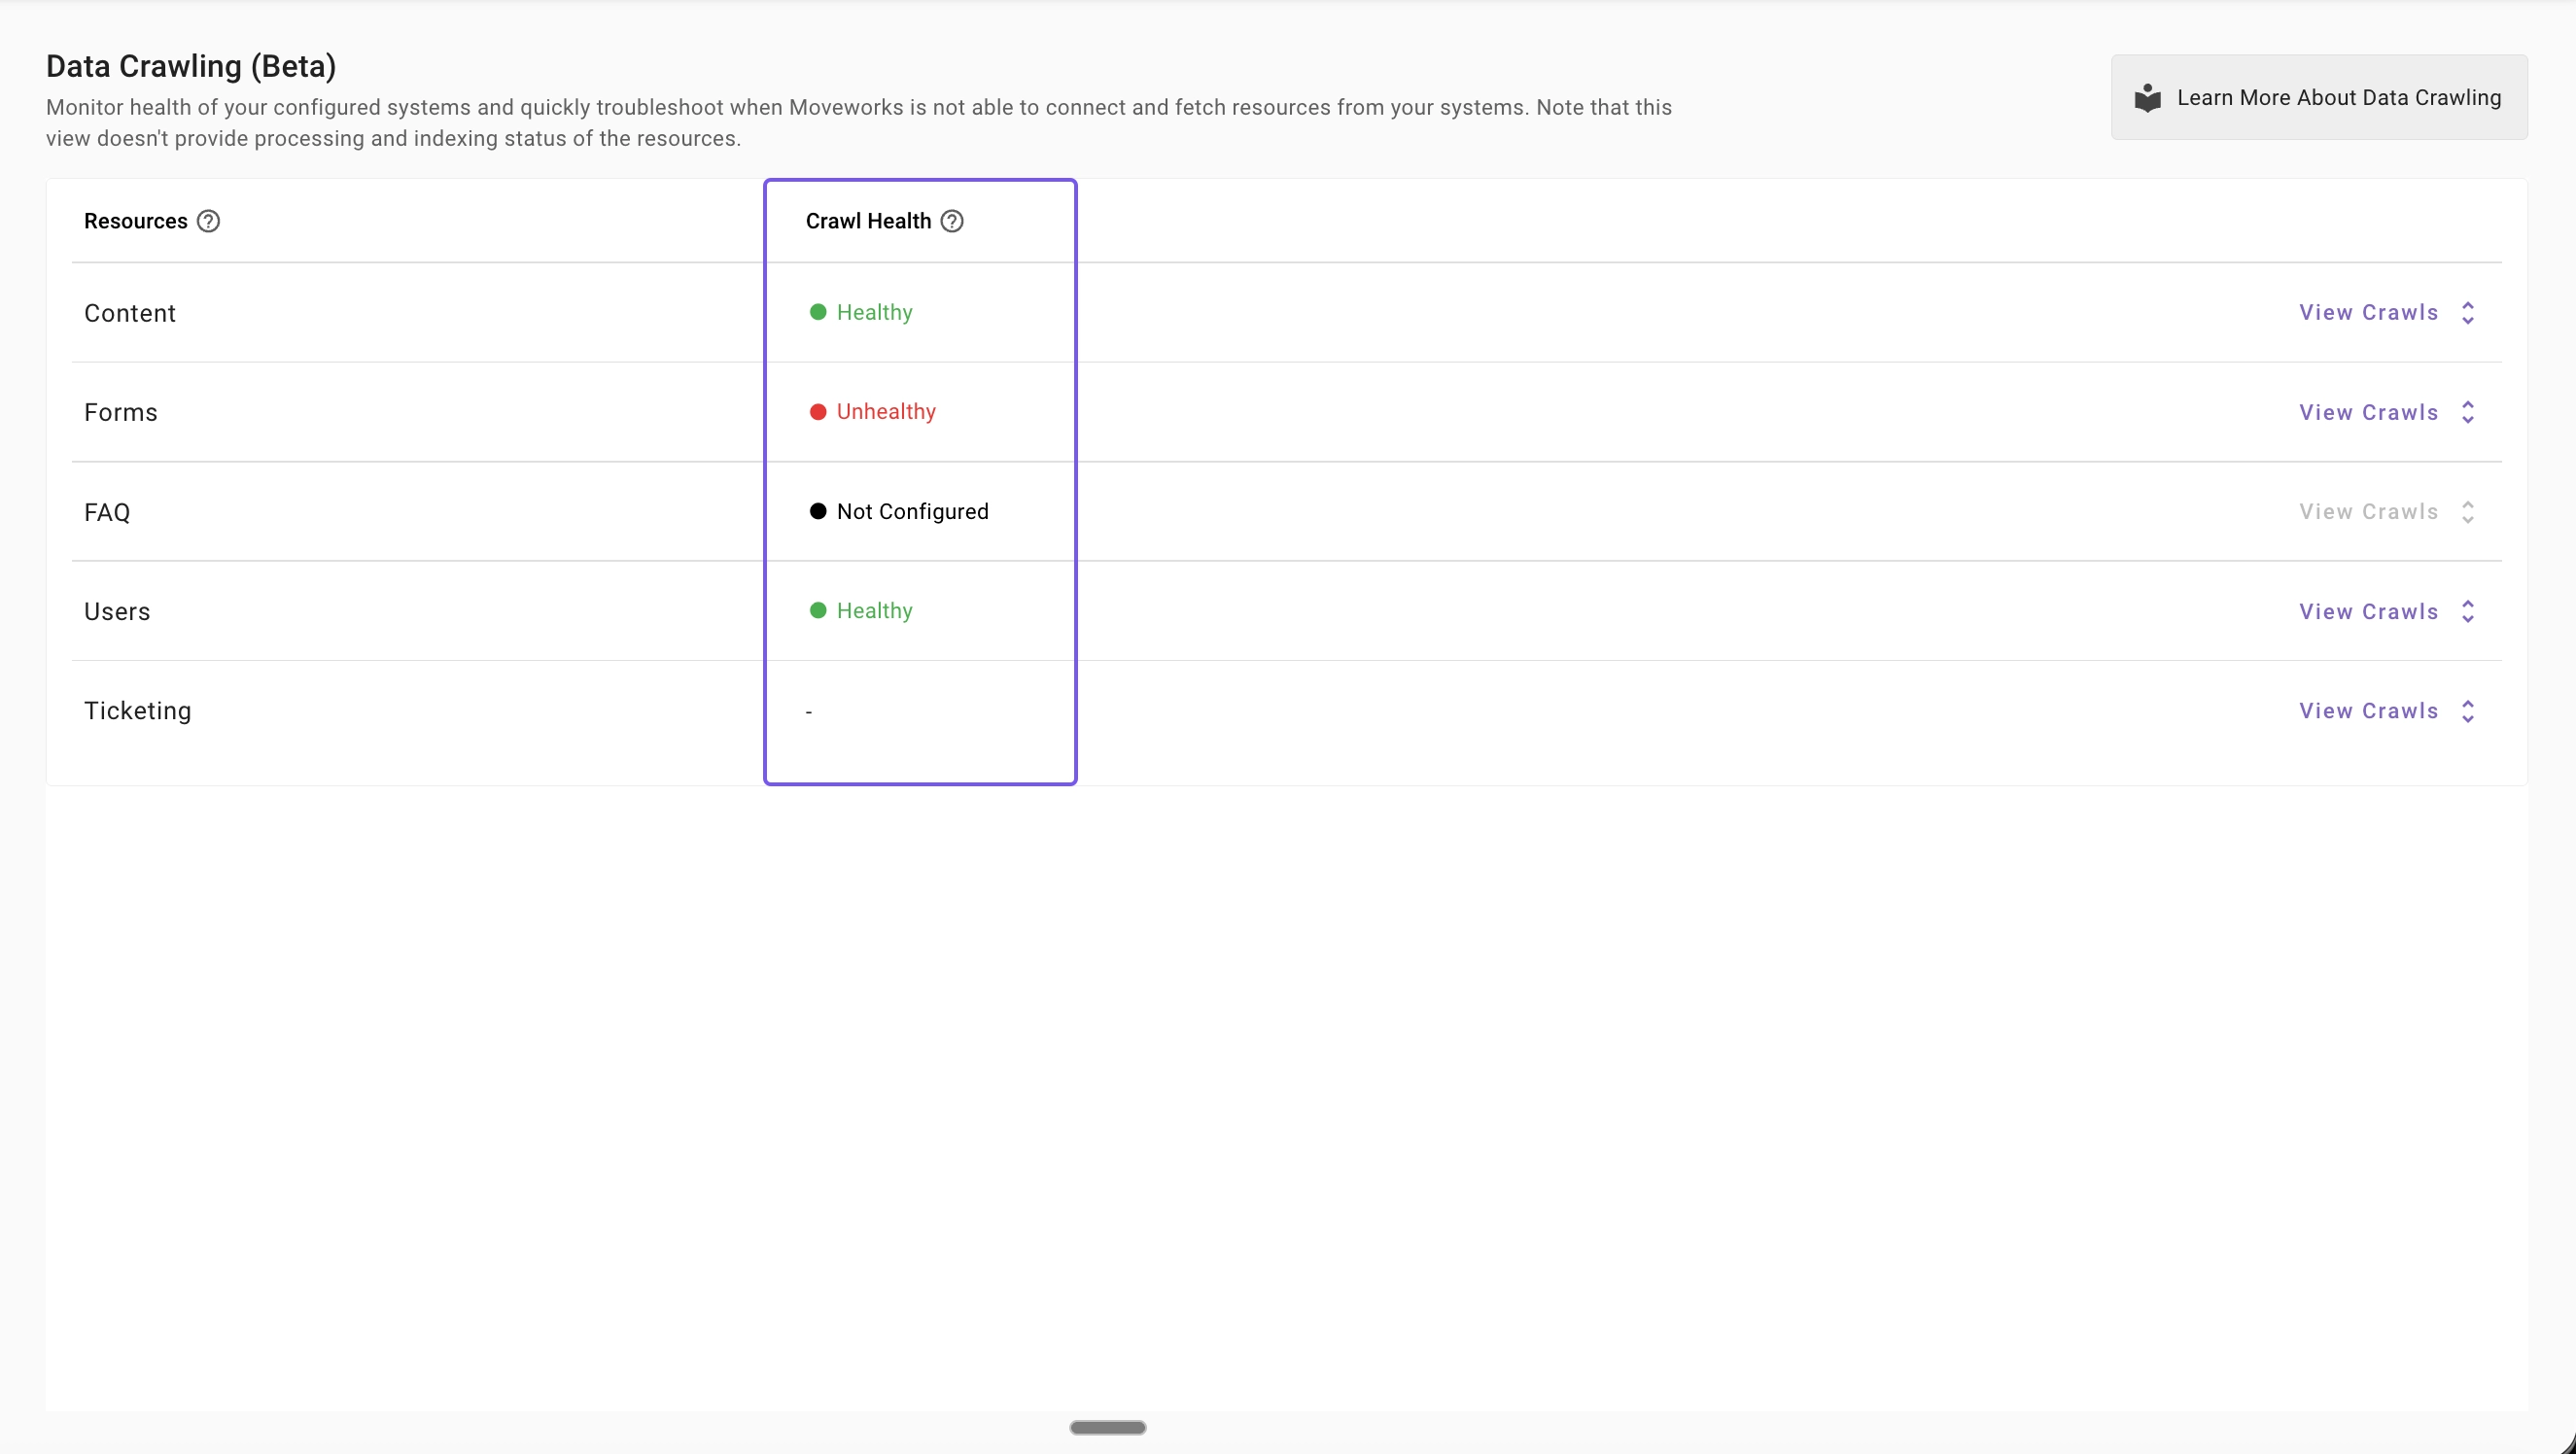
Note: Crawl health is not applicable for Ticketing or Content (new architecture).
Crawl Runs: Full & Incremental
Crawl runs define how data is fetched from external systems to keep resources in Moveworks up to date. There are two types:
- Full Ingestion: Fetches the complete set of records for a resource from the external system. This typically runs less frequently to minimize load on the source system.
- Incremental Ingestion: Fetches only changes, such as newly added or updated records, deleted records, or permission updates, from the external system using webhooks or delta APIs. This is supported for a limited set of systems wherever available and is a more scalable way to keep data up to date with minimal load on the source system.
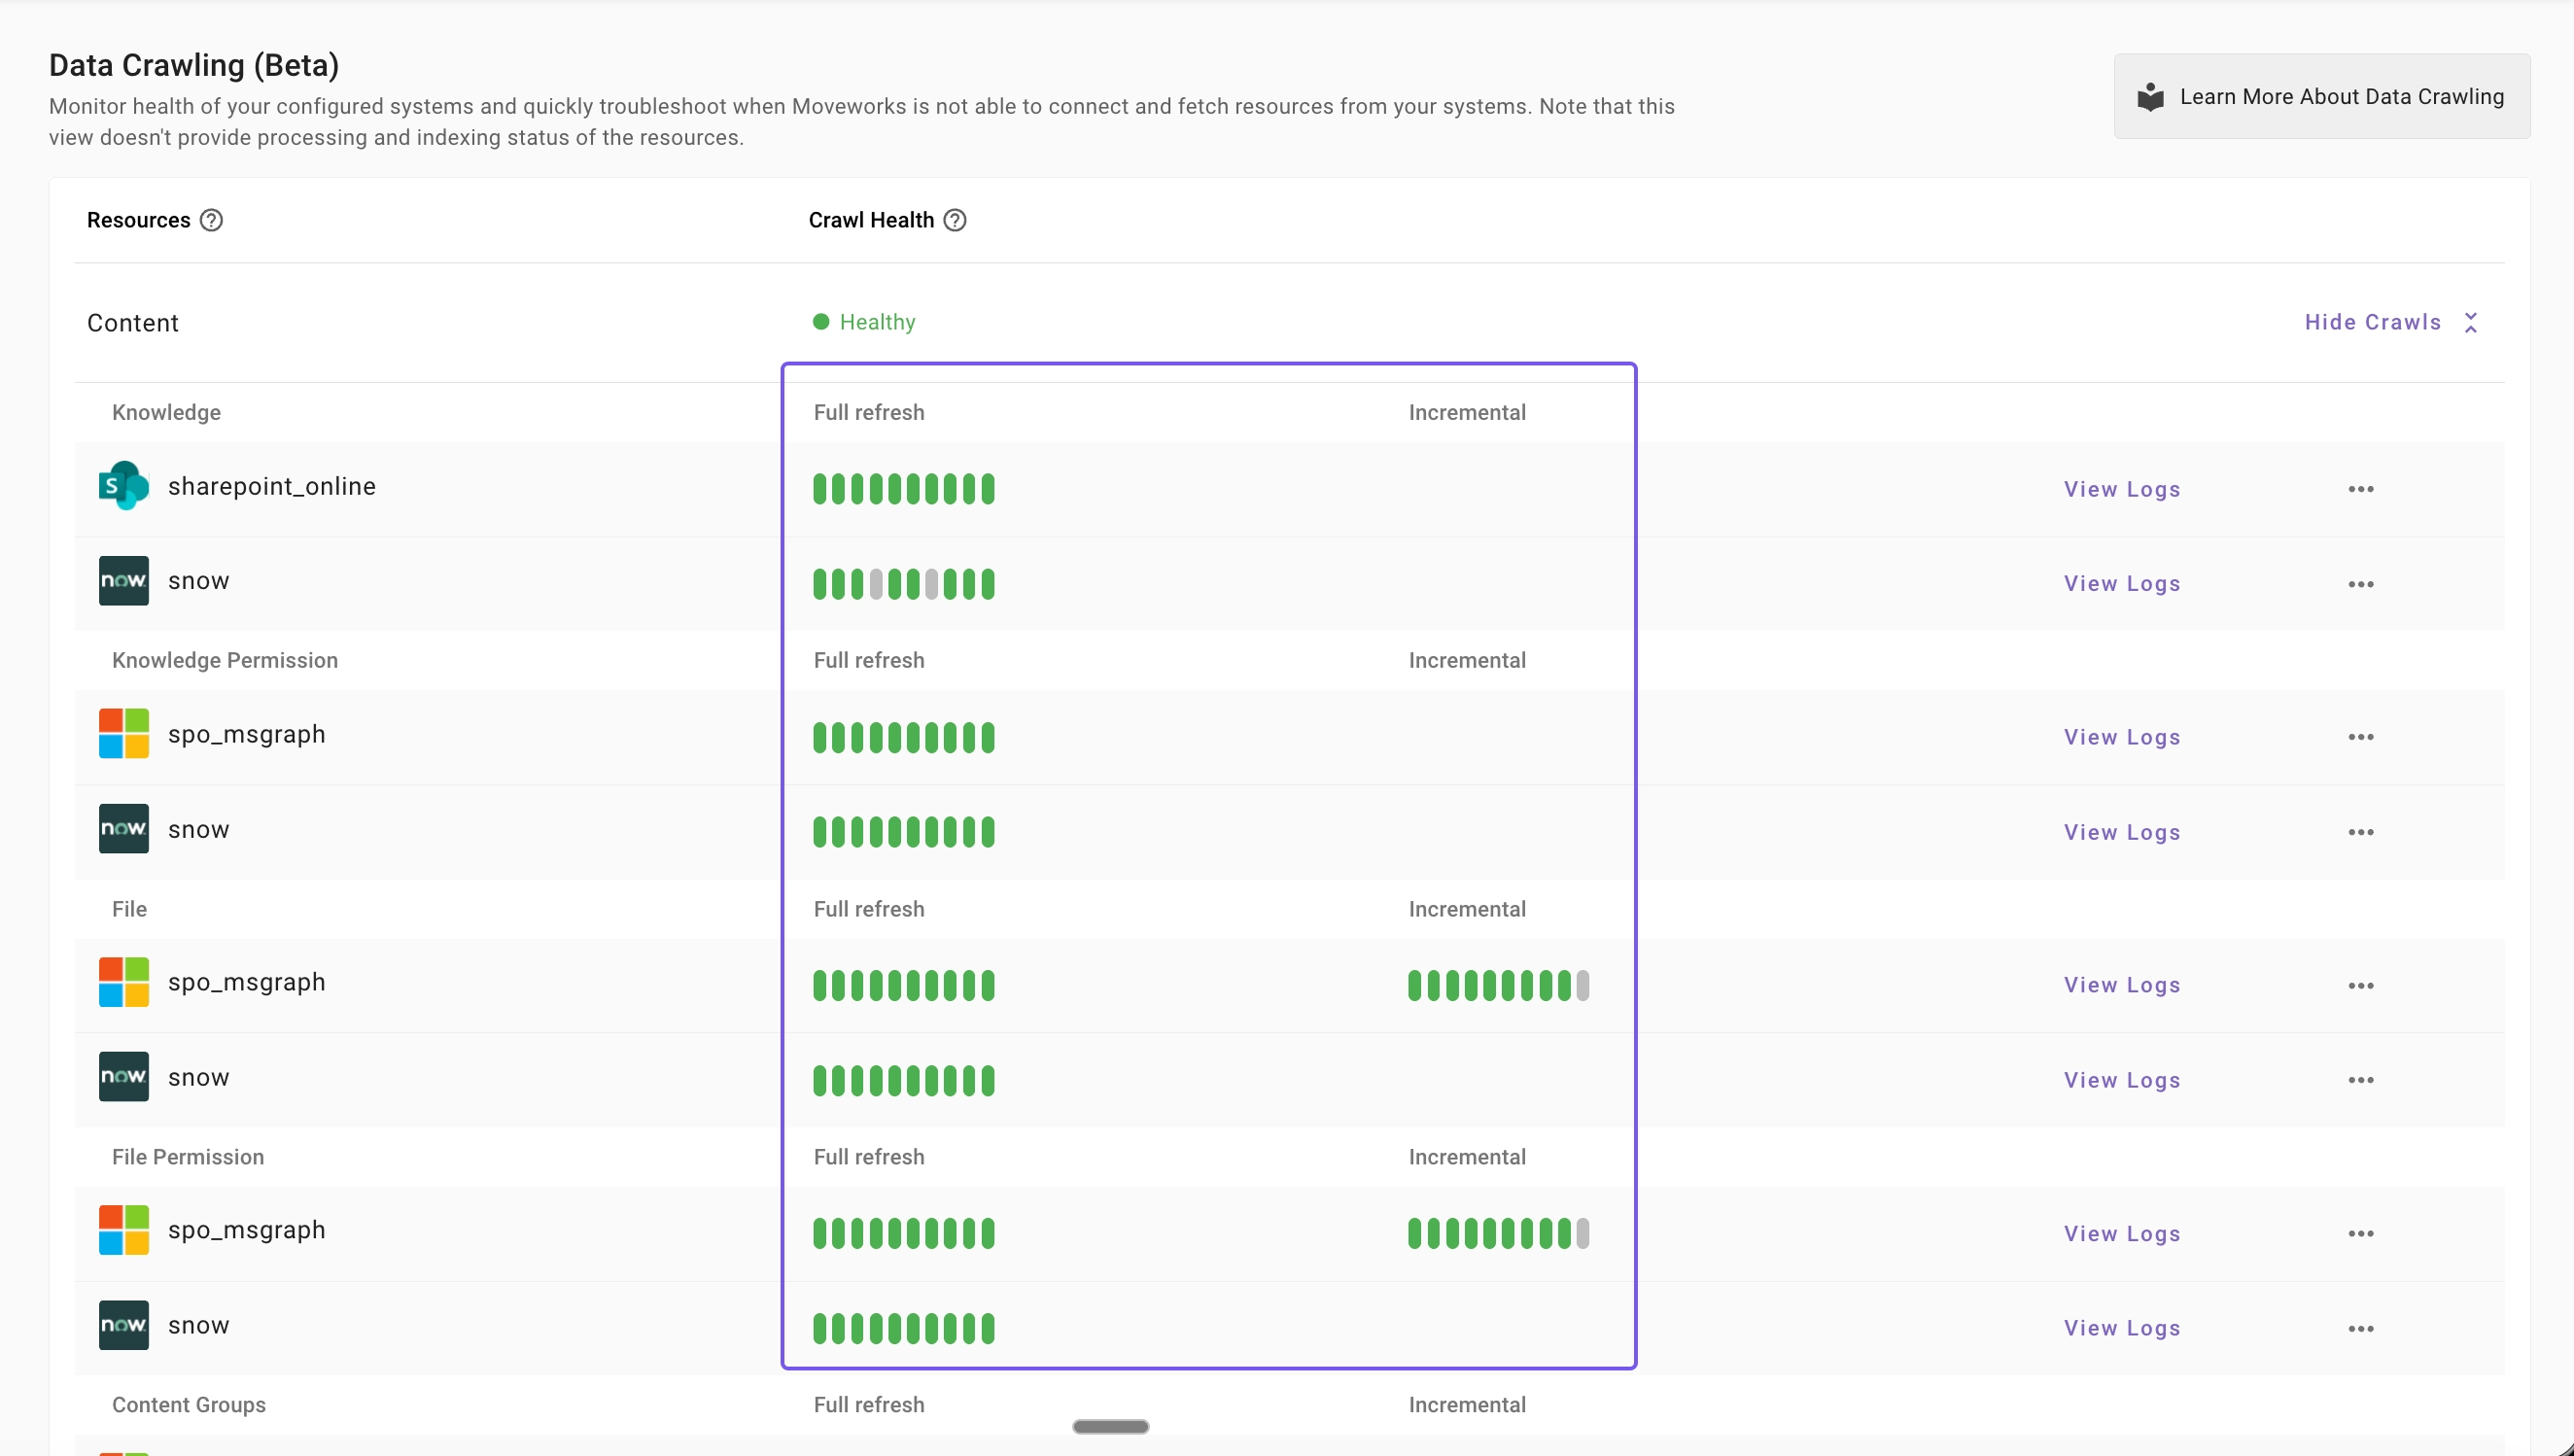
Note: In the original crawl-run view, incremental status bars are shown for resources with incremental crawling. Content (new architecture) does not display these bars; their absence in that section does not indicate whether content updates are being ingested.
Health of Ingestion Runs
- Green bars denote the success of the crawl run.
- Red bars denote failure of the crawl run.
If the latest crawl run (full or incremental) fails, the resource is marked with a red bar to highlight that it requires attention.
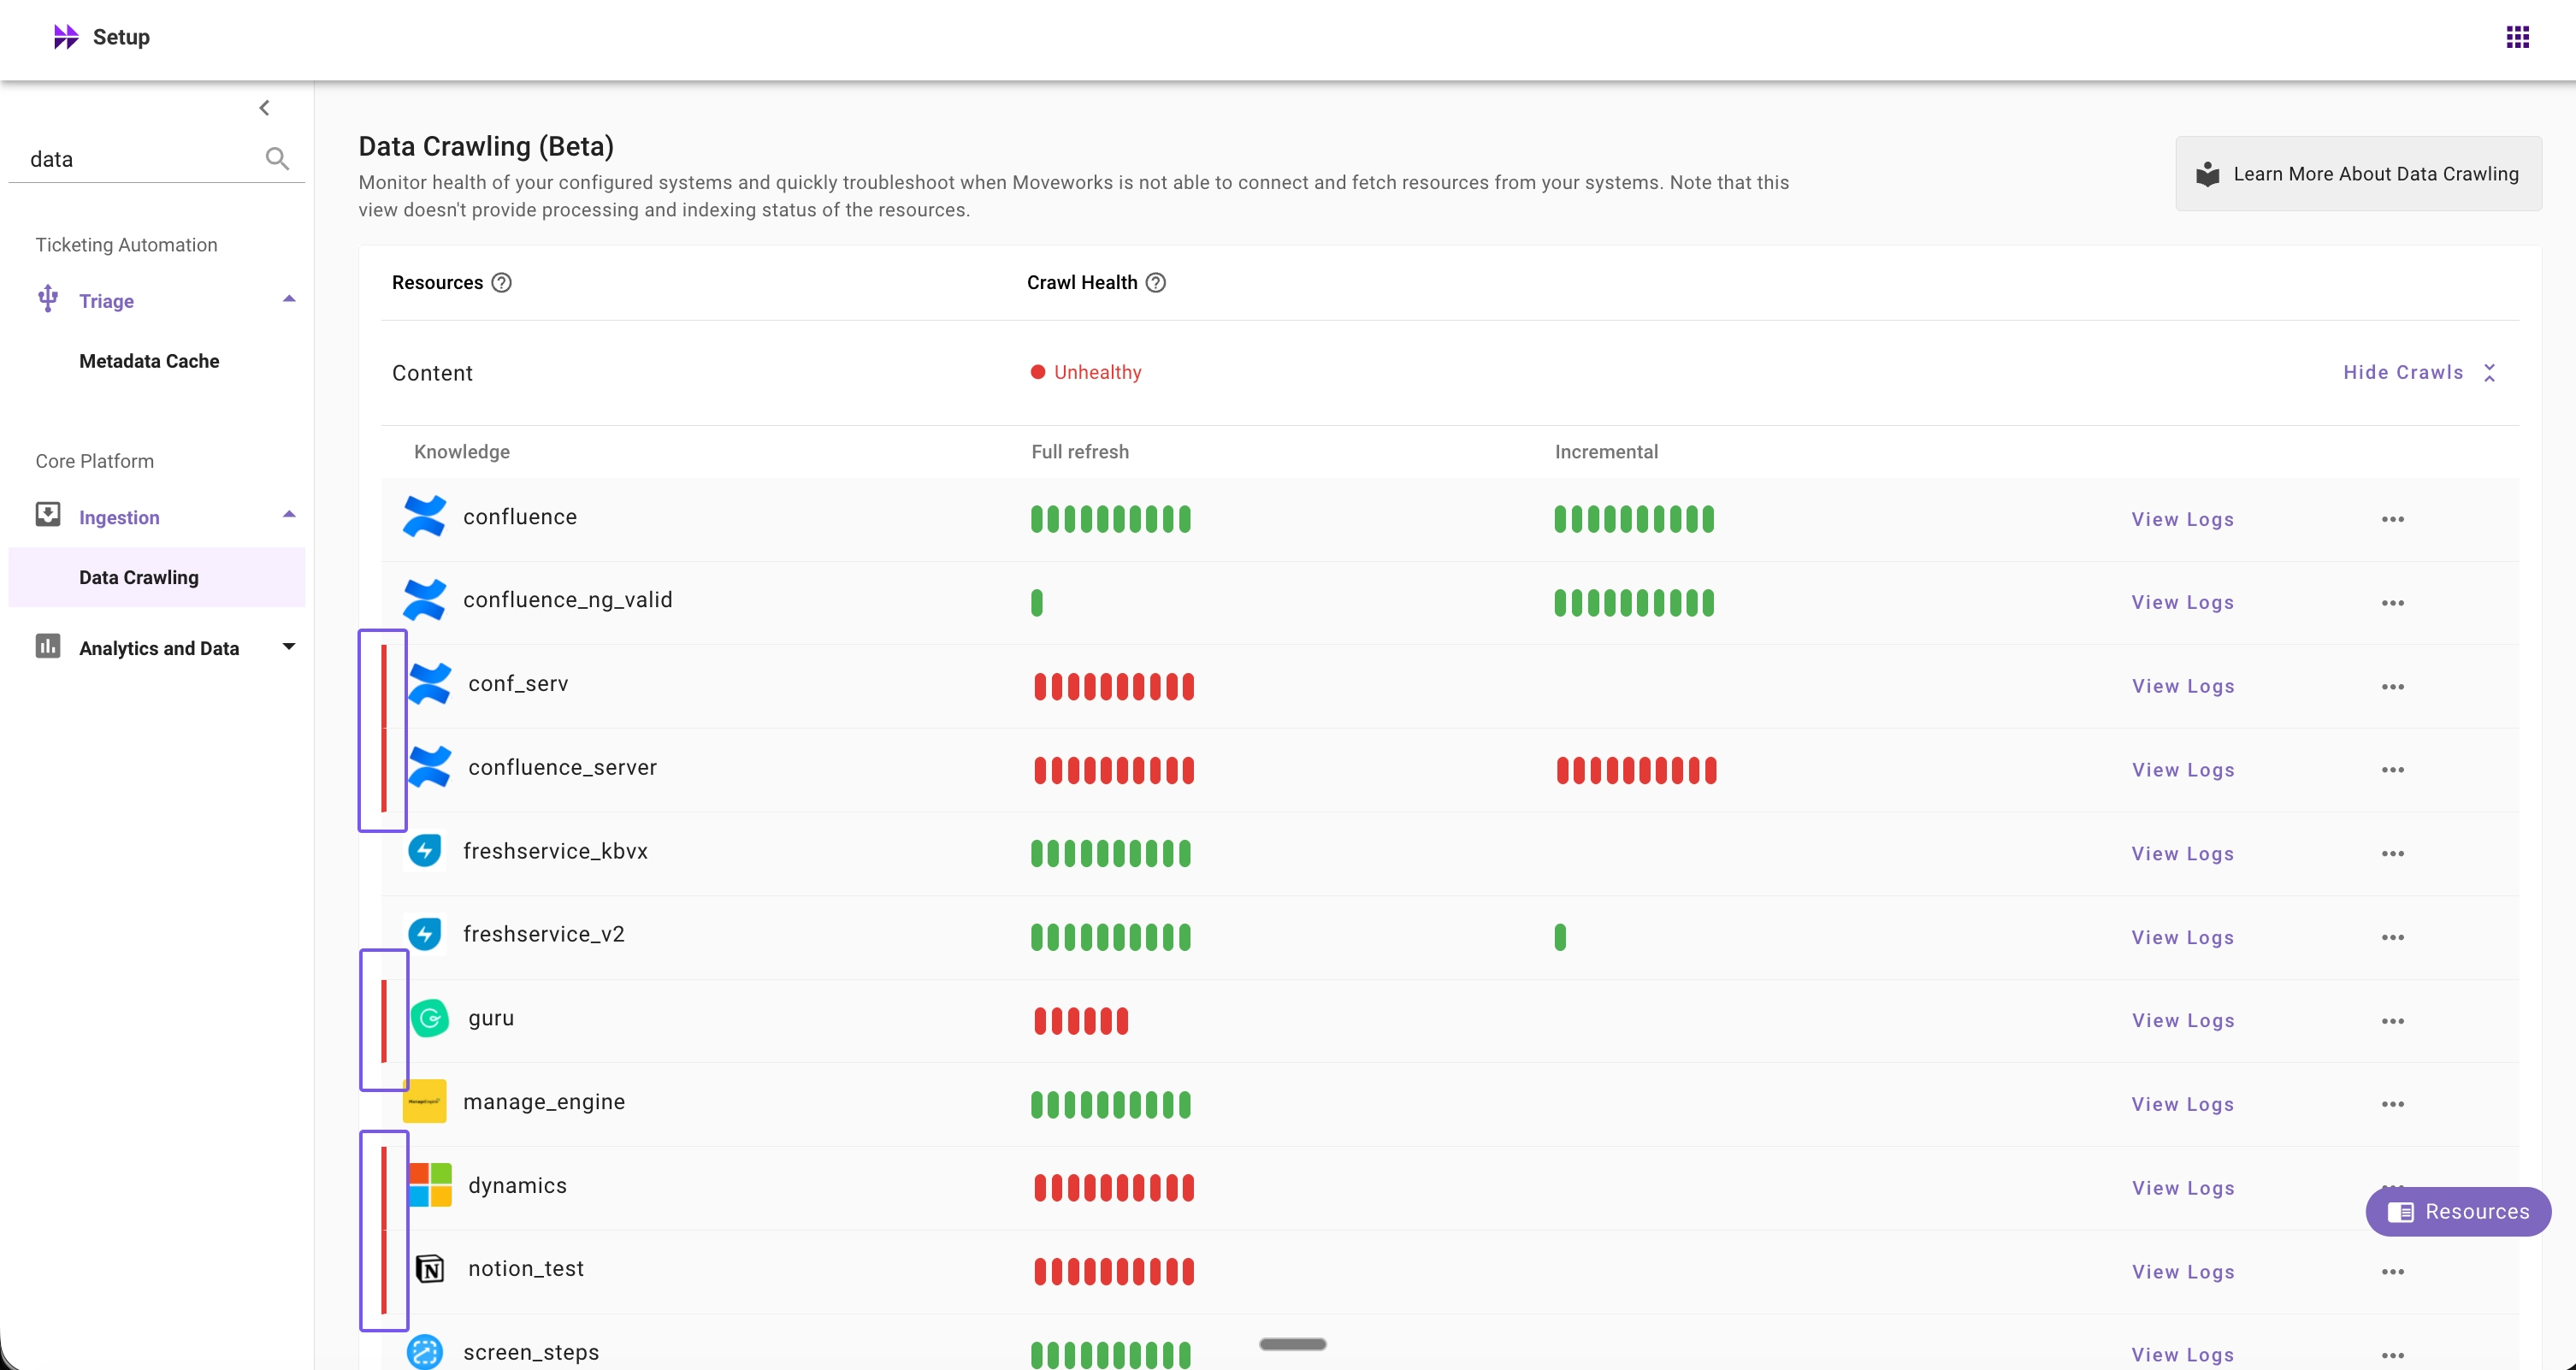
Note: Crawl health is determined by the latest crawl run, whether full or incremental. If it fails, the resource is marked as Unhealthy. The resource is Healthy only if all latest crawl runs succeed.
View Logs
View Logs provides Moveworks admins with visibility into each and all crawl runs, with the following data points:
- Start Time: Time at which the crawl run started.
- End Time: Time at which the crawl run got completed.
- Crawl ID: Unique identifier for the crawl run, useful when contacting Moveworks Support for troubleshooting.
- Crawl Type: Indicates whether the run was Full or Incremental.
- Status: Success or Failed status for the crawl runs.
- Crawled Records: Number of records successfully fetched during the crawl
- This can be 0 even for successful runs, typically during incremental ingestion when no updates are detected in the external system
- This field is blank if the crawl run fails
- Failed Calls: Number of API requests that failed during the crawl.
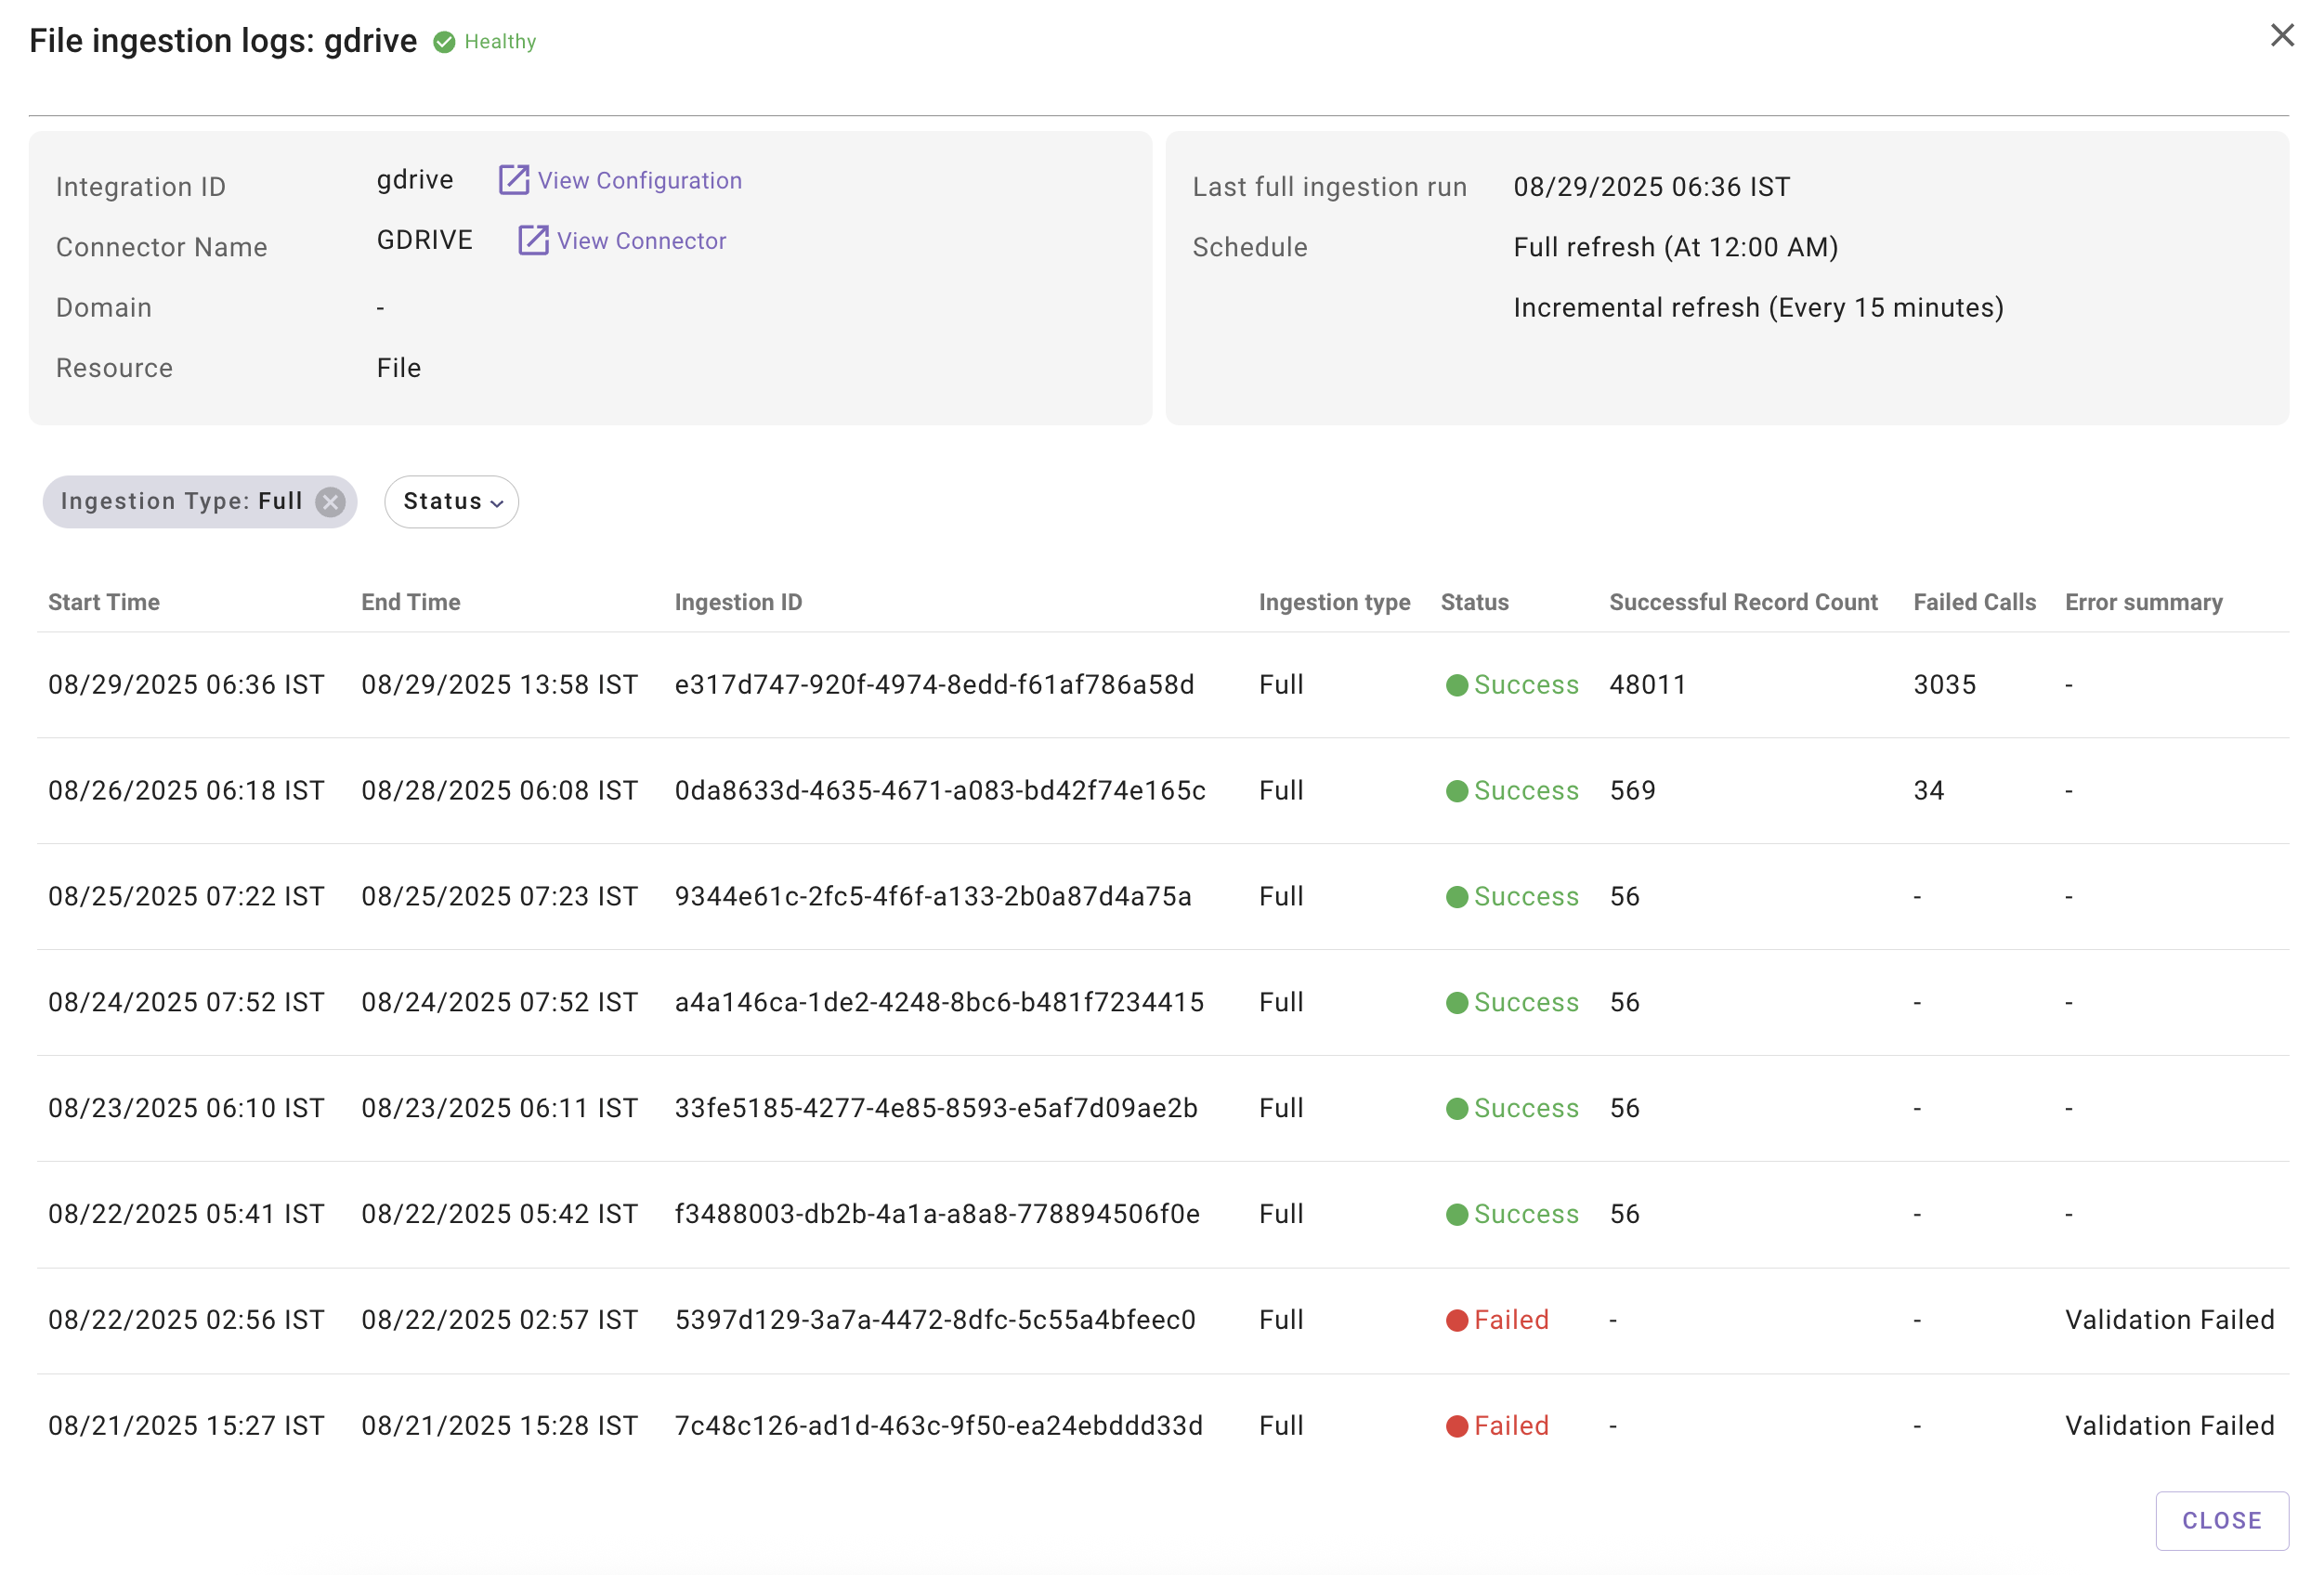
View Logs Table datapoints:
-
Start Time: Time at which the ingestion run started.
-
End Time: Time at which the ingestion run got completed.
-
Ingestion ID: Unique ID of the ingestion run. Useful to share with Moveworks support team, in case of any troubleshooting assistance.
-
Ingestion Type: Denotes whether the ingestion run was Full or Incremental.
-
Status: Success, Failed or Skipped status for the ingestion runs.
Important Note:
Skipped status appears when there are no new records or updates in the external system since the last successful sync. This is expected behavior and indicates your data is current. New records will be automatically ingested during the next ingestion run.
-
Successful Record Count: Denotes how many records were successfully ingested, when the ingestion was successful. This number can be 0 even if the ingestion run was successful - this typically happens in cases of incremental ingestion where no resource updates were made on the external system side. In case of ingestion failure, this will be blank.
-
Failed Calls: Denotes how many calls failed while trying to ingest records successfully. In case of ingestion failure, this will be blank.
-
Error Summary: Simplified error message based on the external system response. An ingestion may fail if:
- The connector credentials are not valid
- There is a server side issue (Deadline exceeded, Time-outs, Rate-Limits)
- There are no permissions/ authorization for Moveworks to ingest any record
- Validation failed
-
View Details: Provides granular visibility into a specific crawl run, showing which records were successfully crawled. This helps Moveworks admins troubleshoot record-level issues such as when expected records aren’t being ingested.
Error summary is available only for Files, Knowledge, Users, Groups, and Permissions.
How to use Error Summary to debug?
- Refer to the error message.
- Look up the Error code and Error Message for the specific system via Google, or your favorite AI tool.
- There are four general themes of errors:
- Incorrect Credentials/ Issues with Authorization: Review access requirement documents, and update the connector credentials.
- Permission Related Issues: Review and add relevant scopes or roles to the connector based on the access requirements documentation.
- Intermittent System Side Issues : Generally - Error 500 or 503 indicate intermittent issues. Work with your system admins, or contact the vendor’s support to address this.
- Validation failed error message: These are Moveworks imposed validations. Generally an ingestion that shows a validation failed error message is likely to fail due to any of the three scenarios:
- Empty record validation: No records were fetched in the full ingestion run. (This could happen due to a mis configuration or if the native system doesn’t have any records in it).
- Record limit validation: The dataset reached the supported content limit (This is only for files)
- Large record drop: More than 50% of the records dropped from the last successful full ingestion run (applicable for KB only).
How to use View Details for troubleshooting?
Crawled Records: Records that were successfully crawled from the source system during a particular ingestion run.
- Record ID: The unique ID of a file fetched from your external system
- Title: The title of a file fetched from your external system
- Crawled at: Timestamp when the content was last crawled
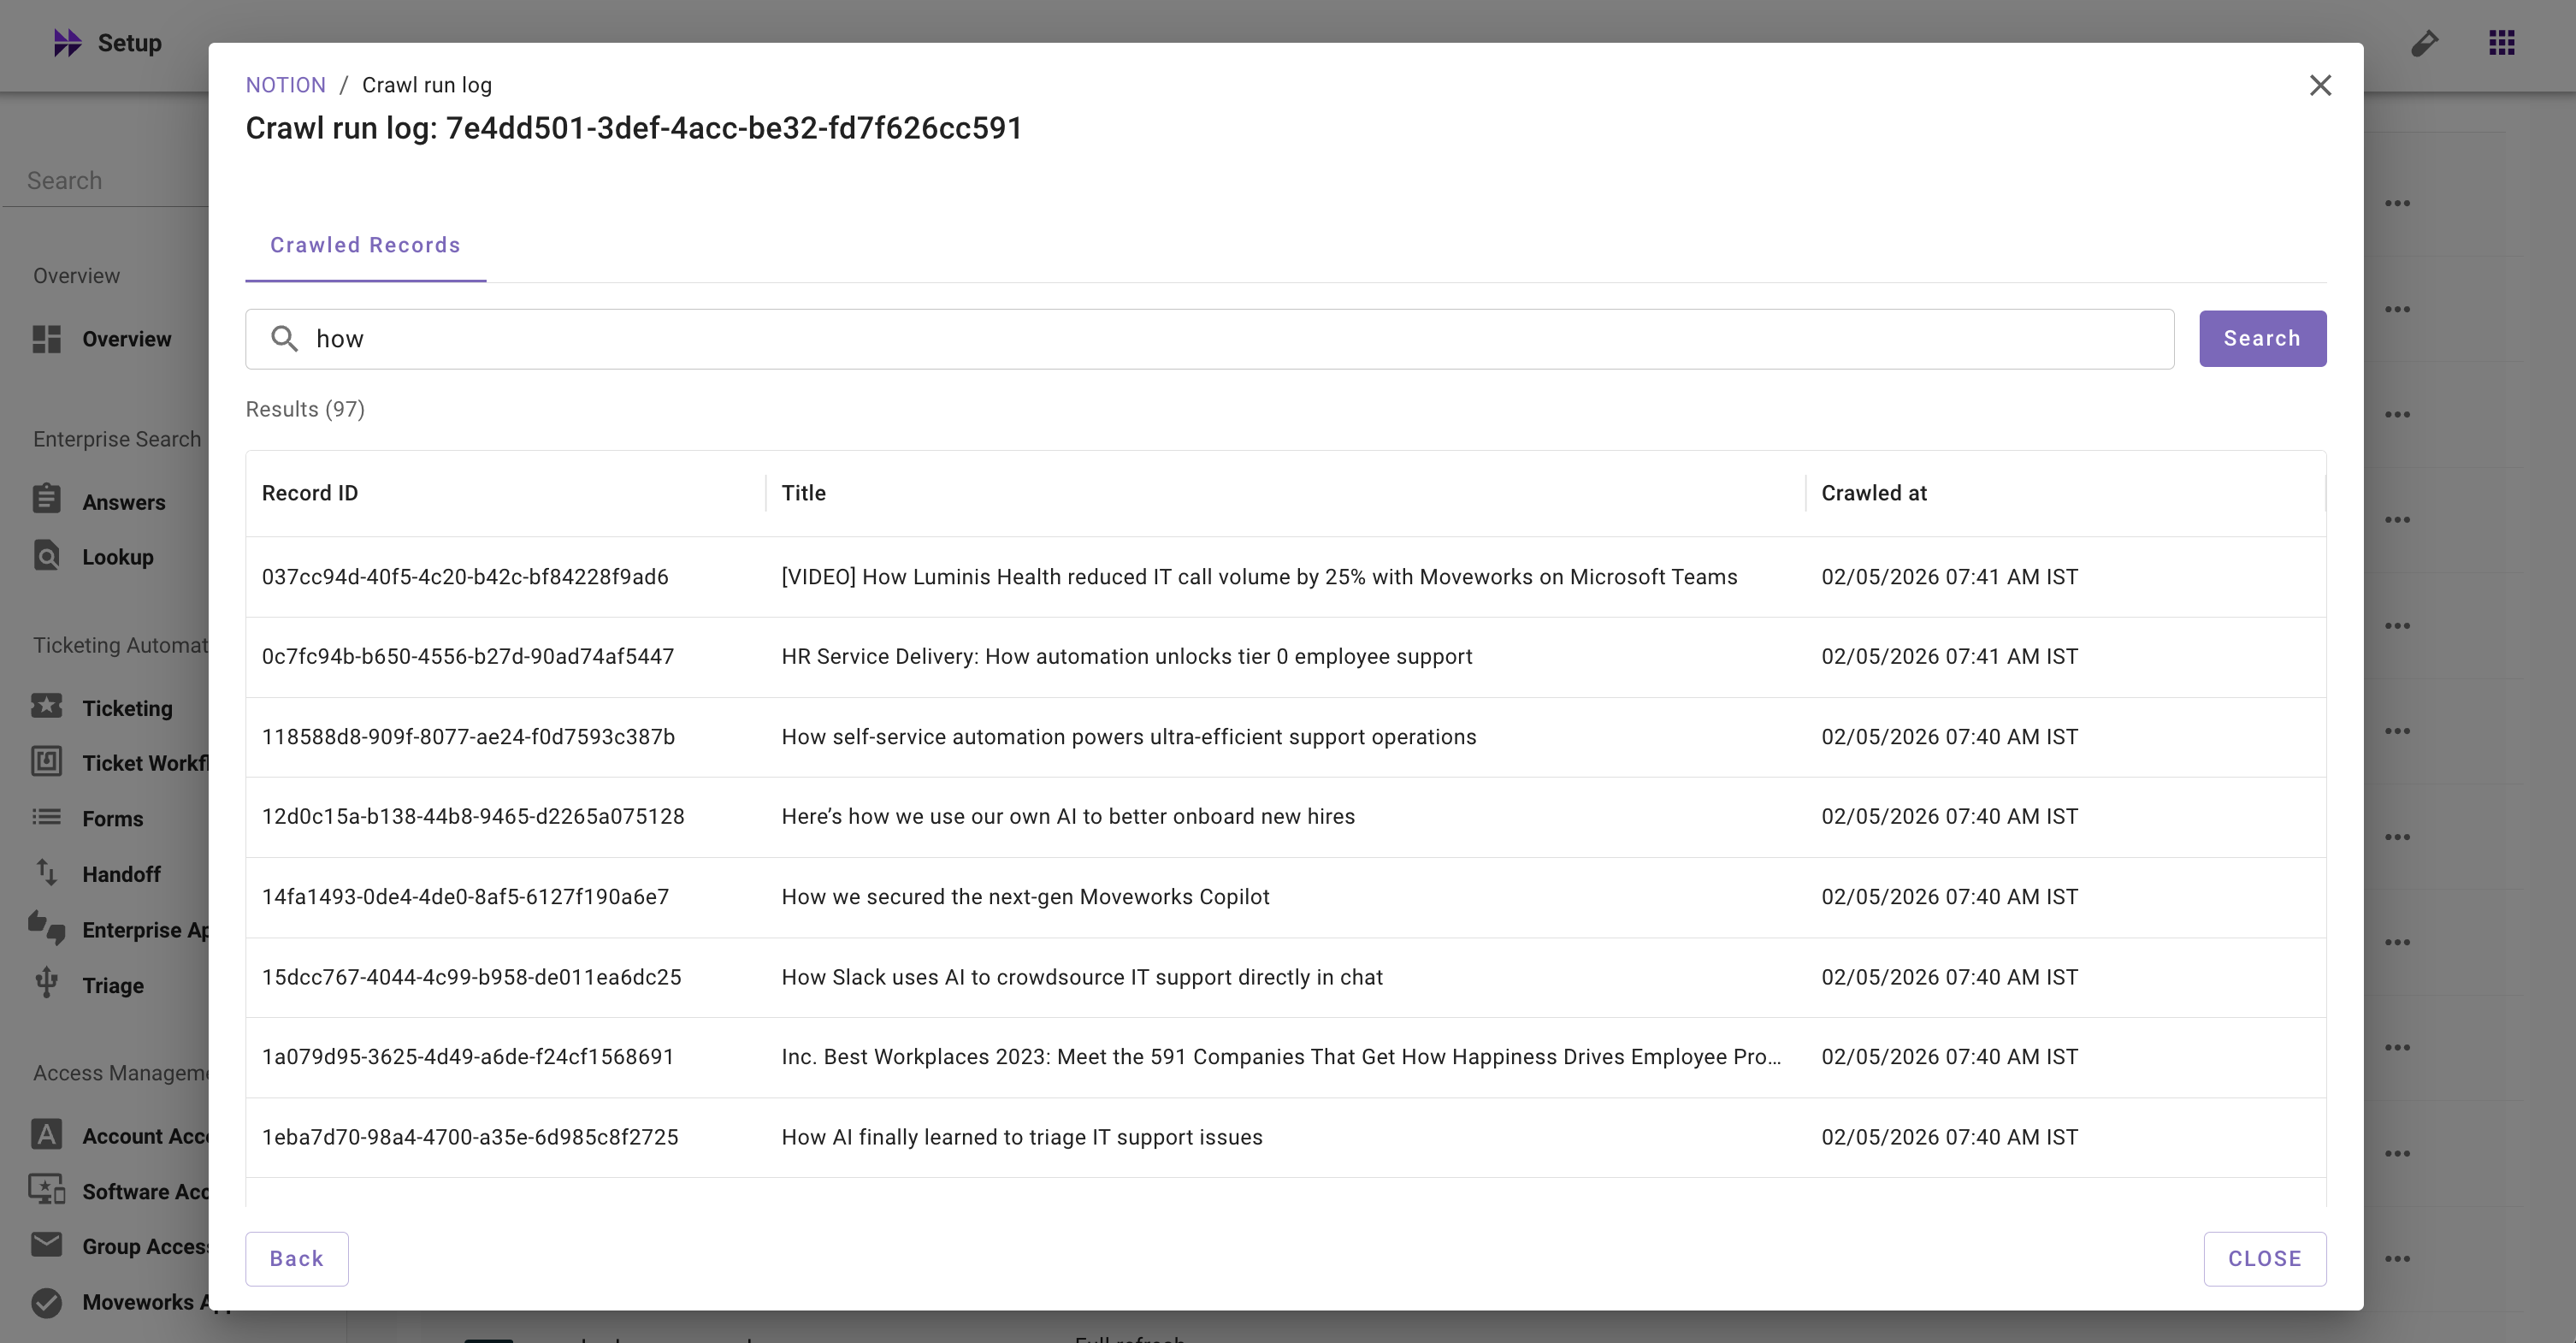
Key scenarios for using View Details for troubleshooting:
- When users report they can’t find specific content - Check if specific articles or files were actually crawled from source system when users say they should be able to find them in search results but can’t
- When content appears outdated or incomplete - Verify what content was actually retrieved during recent crawl runs
- After adding new content sources - Validate that newly configured sites, drives, or spaces are being crawled and content is being crawled from source system as expected
- After setting up or modifying a connector - Verify that your connector is successfully retrieving content from all intended sources and nothing is being missed due to configuration issues
- After source system changes - Validate that content continues to be crawled successfully after updates, migrations, or permission changes in your source systems
FAQs
- My resource status is showing as Disabled. How do I enable it?
- If there are no configurations associated with the Resource, we first recommend you to get the system configured. Then work with Moveworks support or Moveworks customer success team to get the resource enabled for your org.
- Ingestion run is successful but the successful & failed records are showing empty. Is this expected?
- Yes, this is expected and generally observed for incremental ingestion runs. It is very well possible that no datapoints were returned for incremental ingestion runs from Delta APIs that is scheduled for every few mins.
- There is no error summary for ingestion failures in case of Forms, and FAQs?
- Currently, error summary is available only for Files, Knowledge, Users, Groups, and Permissions. We plan to add support for other resources in coming months.
- Is Access DL ingestion configuration supported in this view?
- In case of Groups, we currently only show configurations specific to Content (Files & KBs). It does not cover ingestion of records from Access DL systems. This is on roadmap.
- Is ServiceNow ACL supported in the permissions view?
- In case of Permissions, currently we do not support showing ServiceNow ACL permissions flow. This is on future roadmap.
- I am seeing a historical ingestion run to be still in progress. Is this expected?
- In rare instances, some ingestions do not get completely successfully and time out. In those rare case, they might still show in progress. However, you should not be much concerned with that. For your troubleshooting and monitoring, viewing the status and logs of the latest full or incremental ingestion run will suffice.
- Count of successfully ingested records in the view logs does not match with the ingested records in Indexed Content/ Files/ Users/ Forms screen. Is this expected?
- Yes. For resources with crawl-run history, View Logs shows records fetched in each full or incremental run. Records then go through processing and validation before indexing. For Content (new architecture), the failed-request count measures API request failures, not records. Neither count should be compared directly with Indexed Content counts.